
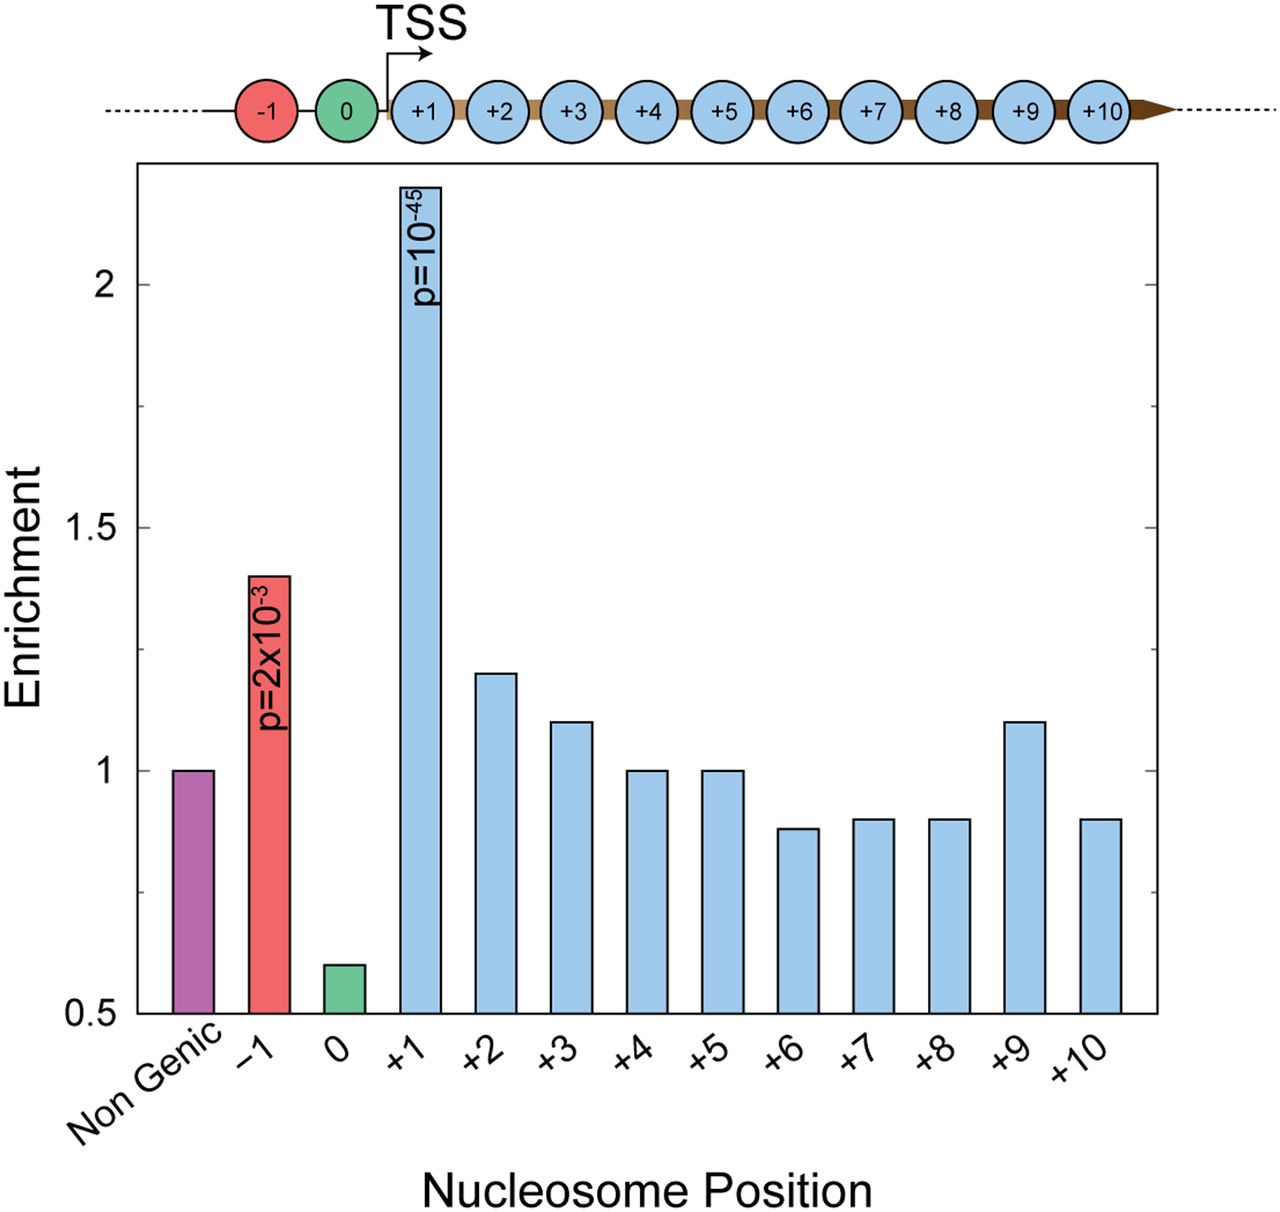
Figure 2.
Positional enrichment of asymmetric nucleosomes. Enrichment of asymmetric nucleosomes at genic nucleosome positions and nongenic positions. P-values calculated using a hypergeometric test are shown for significantly enriched positions (+1 and −1).


