
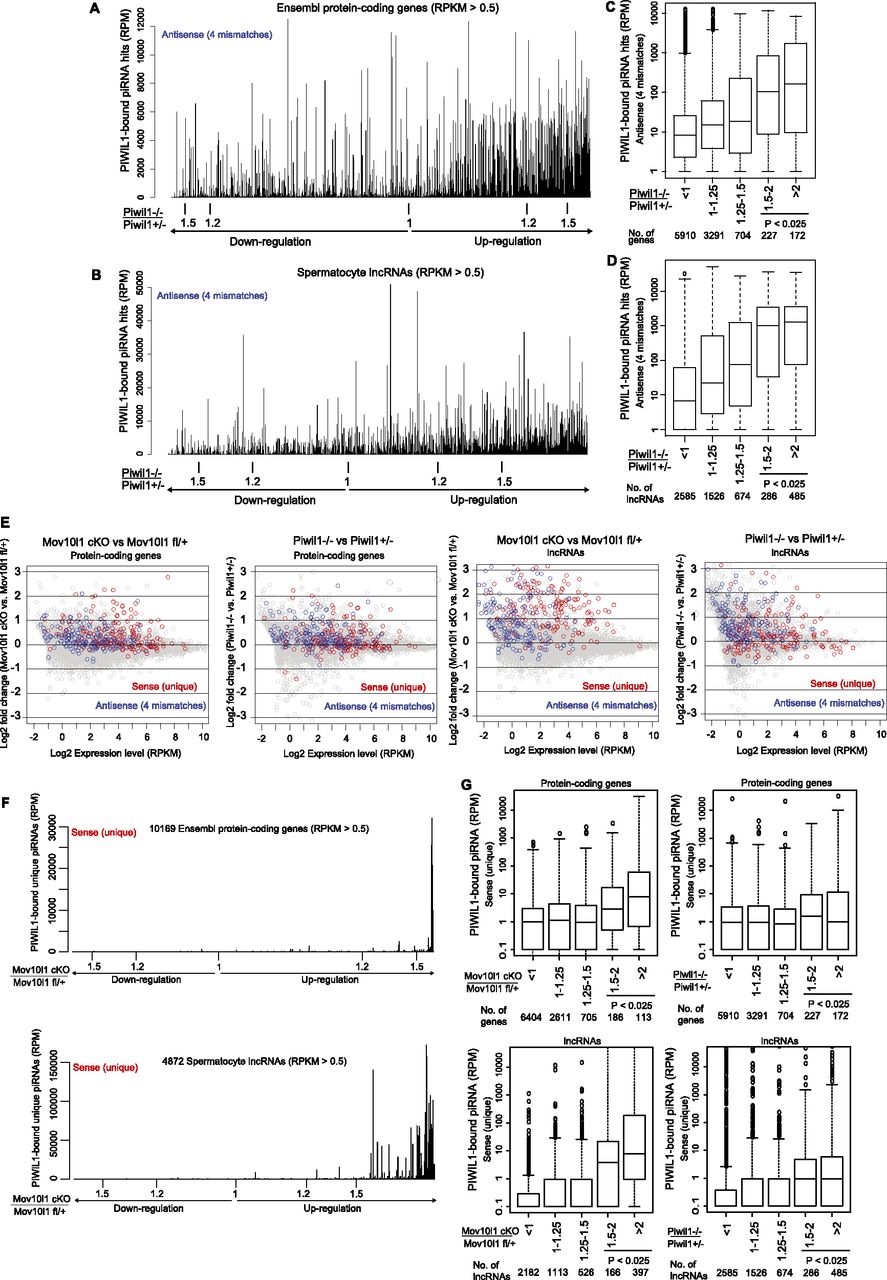
The extent of mRNA and lncRNA up-regulation is strongly correlated to the number of piRNA matches. (A,B) piRNAs are preferentially mapped to the up-regulated mRNAs (A) and lncRNAs (B). The y-axis represents the numbers (RPM) of piRNAs mapped in the antisense orientation by allowing up to four mismatches including up to two indels. Protein-coding genes and lncRNAs on the x-axis are sorted based on the extent of changes in the RNA-seq analysis in Piwil1 KO. (RPM) Reads per million sequenced reads. (C,D) A box plot analyzing the number of piRNA matches in the antisense orientation. Protein-coding genes (C) and lncRNAs (D) are classified into five groups based on the extent of up-regulation in Piwil1−/− mice. When the RPM value was <1, the value was treated as 1. (E) MA plot analysis of mRNA (left) and lncRNA (right) expression in Piwil1 KO and Mov10l1 CKO. The top 200 mRNAs and lncRNAs generating many sense unique piRNAs are highlighted in red. The top 200 mRNAs and lncRNAs having many antisense piRNA hits (four mismatch condition) are highlighted in blue. (F) piRNAs are preferentially generated from the up-regulated mRNAs (top) and lncRNAs (bottom) in Mov10l1 CKO. Protein-coding genes and lncRNAs on the x-axis are sorted based on the extent of changes in the RNA-seq analysis in Mov10l1 CKO. (G) Box plots analyzing the number of unique sense piRNAs generated from mRNAs (top) and lncRNAs (bottom). mRNAs and lncRNAs are classified into five groups based on the extent of up-regulation in Mov10l1 CKO (left) and Piwil1 KO (right) mice. When the RPM value was <0.1, the value was treated as 0.1.


