
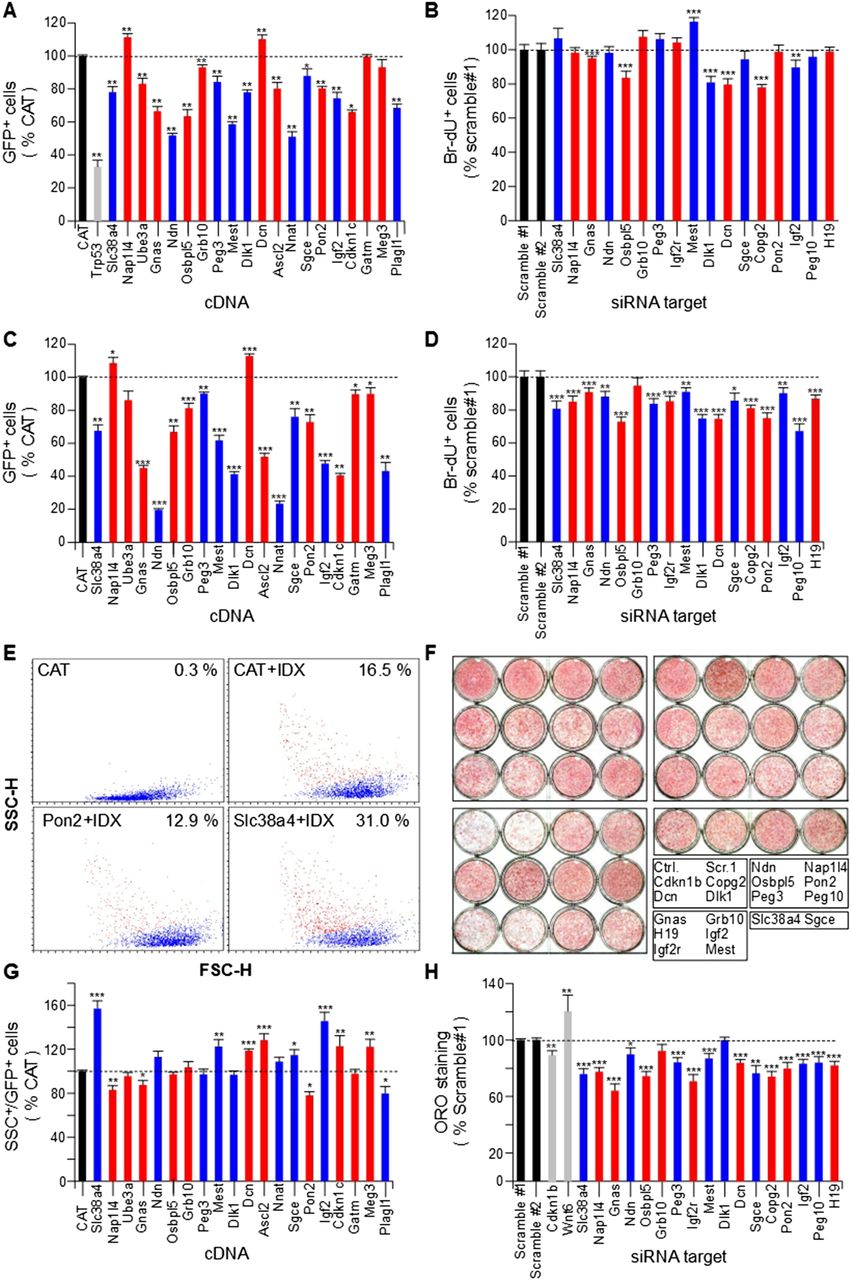
Modulation of imprinted gene expression alters cell cycle exit and adipogenic differentiation of 3T3-L1 preadipocytes. (A) Effect of IG overexpression on cell numbers during exponential growth. Exponentially growing 3T3-L1 cells were cotransfected with eGFP and CAT (chloramphenicol acetyl transferase) as a negative control, Trp53 as a positive control of cell growth inhibition, or cDNAs encoding the indicated IGs. Following plating at low density, GFP-positive cells were counted 48 h post-transfection (n = 8): 84.8 ± 6.4% CAT-transfected cells were GFP positive. (B) Effect of IG down-regulation on DNA synthesis during exponential growth. Exponentially growing 3T3-L1 cells were transfected with siRNAs targeting the indicated IGs and plated at low density. DNA synthesis was monitored by measuring BrdU incorporation 24 h post-transfection (n = 20) and compared to the appropriate control condition, which displayed 31.9 ± 4.0% BrdU-positive cells. (C) Effect of IG overexpression on cell numbers during clonal expansion. 3T3-L1 cells were cotransfected as in A and plated at confluence. Three days post-transfection, cells were incubated with IDX to trigger adipogenic differentiation. GFP-positive cells were counted 8 d after IDX addition (n = 14): 26.2 ± 5.2% CAT-transfected cells were GFP positive. (D) Effect of IG down-regulation on DNA synthesis when cells reach confluence. 3T3-L1 cells were transfected as in B and plated at mid-confluence. DNA synthesis was monitored as in B (n = 20 for Ndn and Sgce; n = 30 for all other IGs): 11.5 ± 2.4% of control cells were BrdU positive. (E) Effect of Pon2 and Slc38a4 overexpression on adipogenic differentiation of 3T3-L1 preadipocytes. Cells were transfected as in A and plated at confluence. Eight days after IDX addition, cell size (forward light scattering [FSC]) and granularity (side light scattering [SSC]) of GFP-positive cells were measured by flow cytometry. SSC allows visualizing accumulation of lipid vesicles in differentiated adipocytes (red dots). (F) Effect of IG down-regulation on adipogenic differentiation of 3T3-L1 preadipocytes. Representative Oil Red O (ORO, a lipid stain) staining of 3T3-L1 cells that were left untransfected (Ctrl.) or transfected with scramble siRNA (Scr.1) or with siRNAs targeting the indicated genes, plated in duplicate at confluence, incubated with IDX 3 d post-transfection, and fixed 12 d later (n = 20 for Ndn and Sgce; n = 30 for all other IGs). (G) Effect of IG overexpression on adipogenic differentiation of 3T3-L1 preadipocytes. Cells were transfected and treated as in A. Quantification of SSC-, GFP-positive cells after transfection and induction of differentiation, compared to the CAT negative control at day 8 of differentiation (n = 16). (H) Effect of IG down-regulation on adipogenic differentiation of 3T3-L1 preadipocytes. Cells treated as in B were stained with ORO, which was quantified as described in Methods (n = 30). Cdkn1b and Wnt6 are positive controls negatively and positively affecting the adipogenic differentiation process, respectively. Data are mean ± SEM of the indicated number of replicate measures from at least three independent experiments. Statistical significance was assessed using a nonparametric, pairwise Wilcoxon test. (*) P < 0.05; (**) P < 0.01; (***) P < 0.001.


