
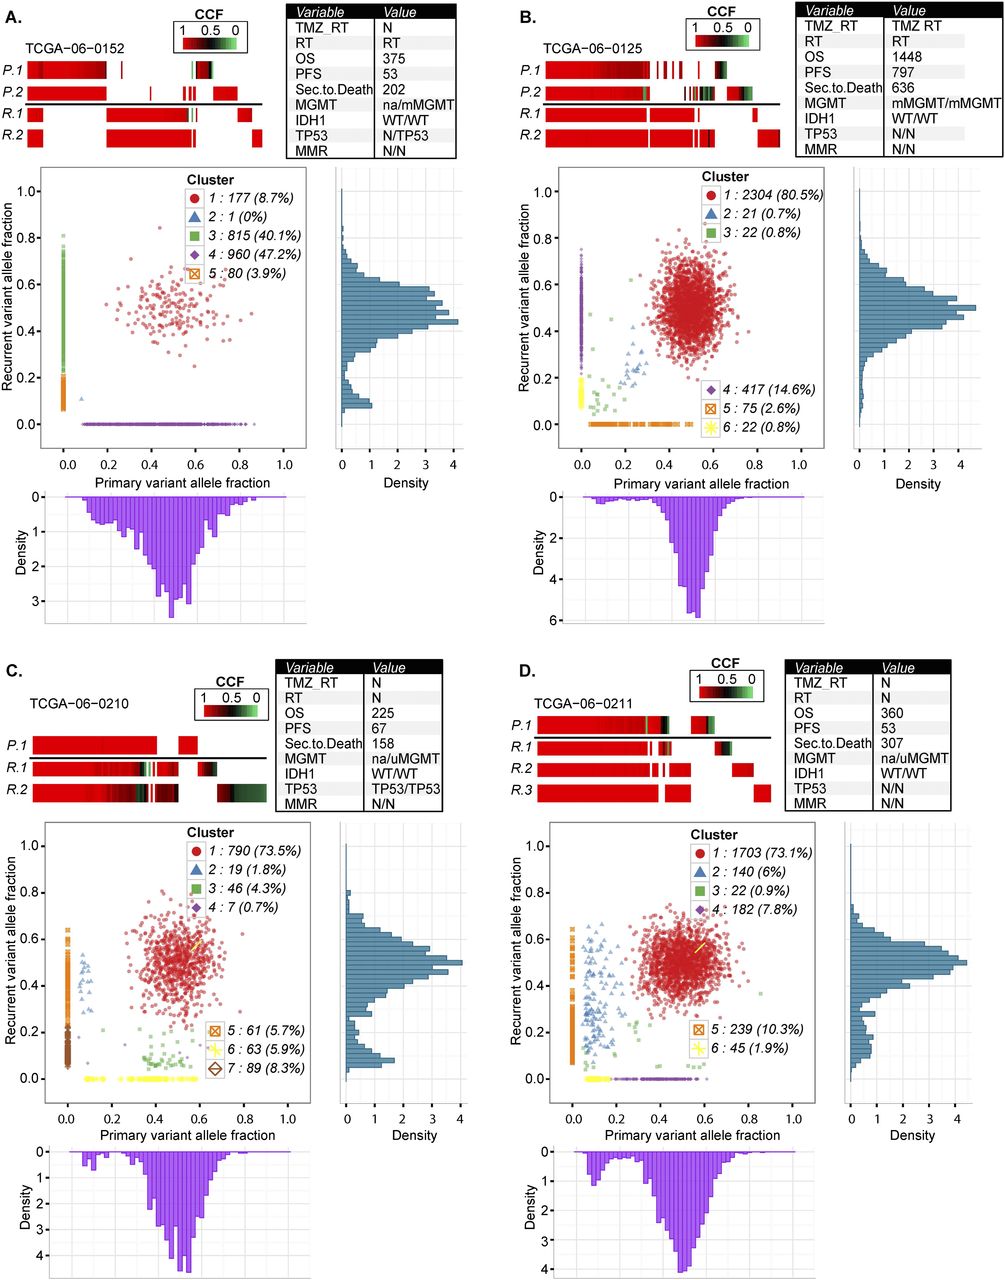
Comprehensive comparison of mutations in four pairs of primary and recurrent GBM. Each row in the upper panels of A–D represents exonic mutations detected in sectors of the primary tumor (P.1, P.2) and exonic mutations detected in sectors of the matching recurrent GBM (R.1, R.2, R.3). Mutations are color-coded for cancer cell fractions (tumor purity-corrected cellular frequencies), in which a cancer cell fraction of 1.0 indicates that a mutation was present in all tumor cells. The columns represent the same chromosomal nucleotide position in all samples displayed. The bottom panels of A–D show scatter plots of the copy-neutral and non-LOH localizing mutations detected in whole-genome sequencing data of the primary and recurrent tumor. The x-axis and y-axis indicate purity-scaled variant allele fractions. Variant allele frequency distribution plots for individual tumors are also displayed at the bottom for primary tumor and at the right side for its matching recurrent tumor.


