
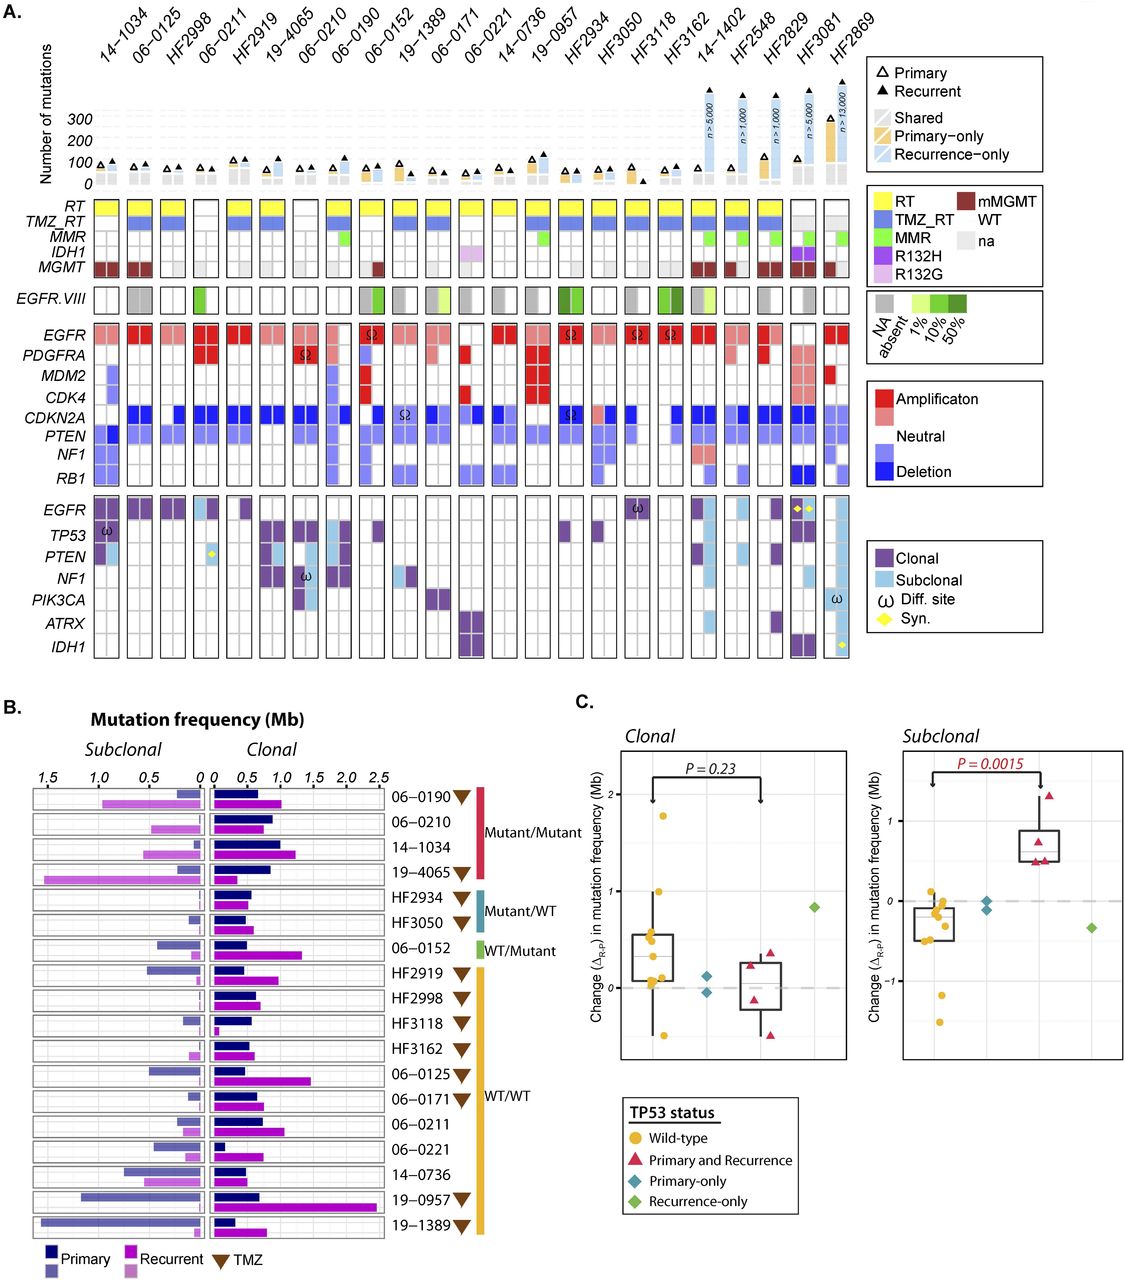
Spectrum of somatic mutations in primary and recurrent GBM. (A) The number of mutations detected in exome sequencing (top panel), clinical characteristics (second panel), EGFRvIII aberrations (third panel), copy number alterations (fourth panel), and somatic exonic mutations (bottom panel). Only frequently amplified, deleted, and mutated GBM genes are included in the copy number and mutation panels. ω (mutation of a different nucleotide in the same gene); Ω (DNA copy number alteration defined by different breakpoints). Clonal status for one sample with an extreme number of mutations could not be reliably classified and is shown in gray. (B) Comparison of subclonal (left panel) and clonal (right panel) mutation frequencies between primary or secondary GBM and matching recurrent tumors. Patients treated with TMZ are indicated with a brown triangle. (C) Association of TP53 mutation with subclonal mutational burden. Changes in clonal (left panel) and subclonal (right panel) mutation frequency are indicated as yellow dots for GBM harboring wild-type TP53 and purple triangles for tumors with mutated TP53 in both primary and recurrent tumors. The green diamond represents a patient who acquired a TP53 mutation at GBM recurrence; the blue diamond represents a case where a TP53 mutation was observed in the primary but not the matching tumor recurrence. A P-value was obtained by performing a Wilcoxon rank-sum test comparing subclonal mutation frequency change between TP53 wild-type and mutant groups.


