
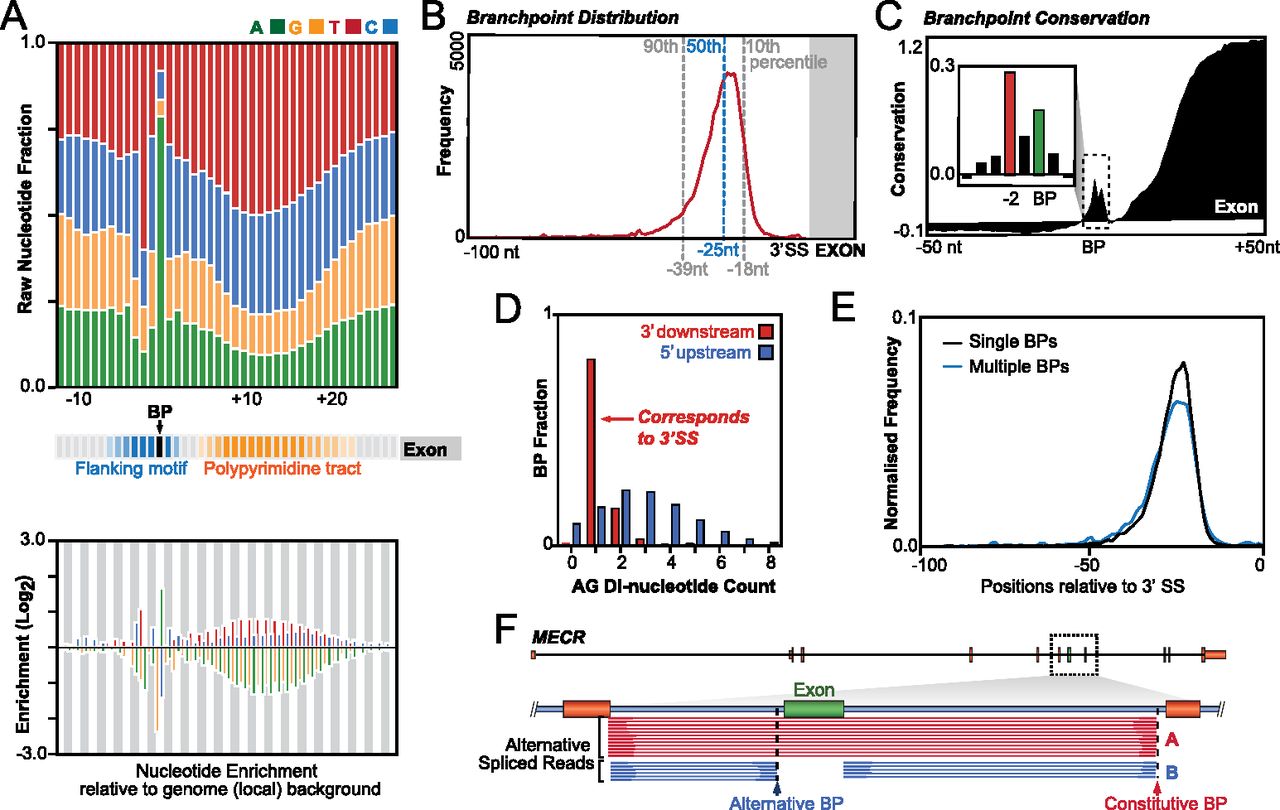
Sequence context and usage of branchpoints. (A) Distinct nucleotide composition (upper panel) of branchpoints and downstream PPT. Fold enrichment of nucleotide composition relative to local genome background (lower panel). (B) Frequency distribution of branchpoints relative to the 3′ splice site (dashed lines indicate 10th, 50th, and 90th percentiles). (C) Vertebrate conservation profile (100 species) across 100-nt window shows conservation peak around the branchpoint (boxed). Downstream elevated conservation is due to exon sequence. Detailed inset shows relative conservation of the branchpoint and flanking −2 upstream nucleotide (red). (D) AG dinucleotide counts upstream of branchpoints (blue) and in the downstream intervening region (red) show that the majority of AG dinucleotides in intervening regions correspond to the 3′ splice site. (E) Frequency distribution of singleton (black) and multiple (blue) branchpoints relative to the 3′ splice site. (F) Alternative splicing of a cassette exon (green) in the MECR gene is revealed by lariat reads which have a common 5′ intron termini but utilize branchpoints associated with different 3′SS (red and blue arrows). Blue lariat reads include the cassette exon into the mRNA, while the red lariat reads exclude the cassette exon.


