
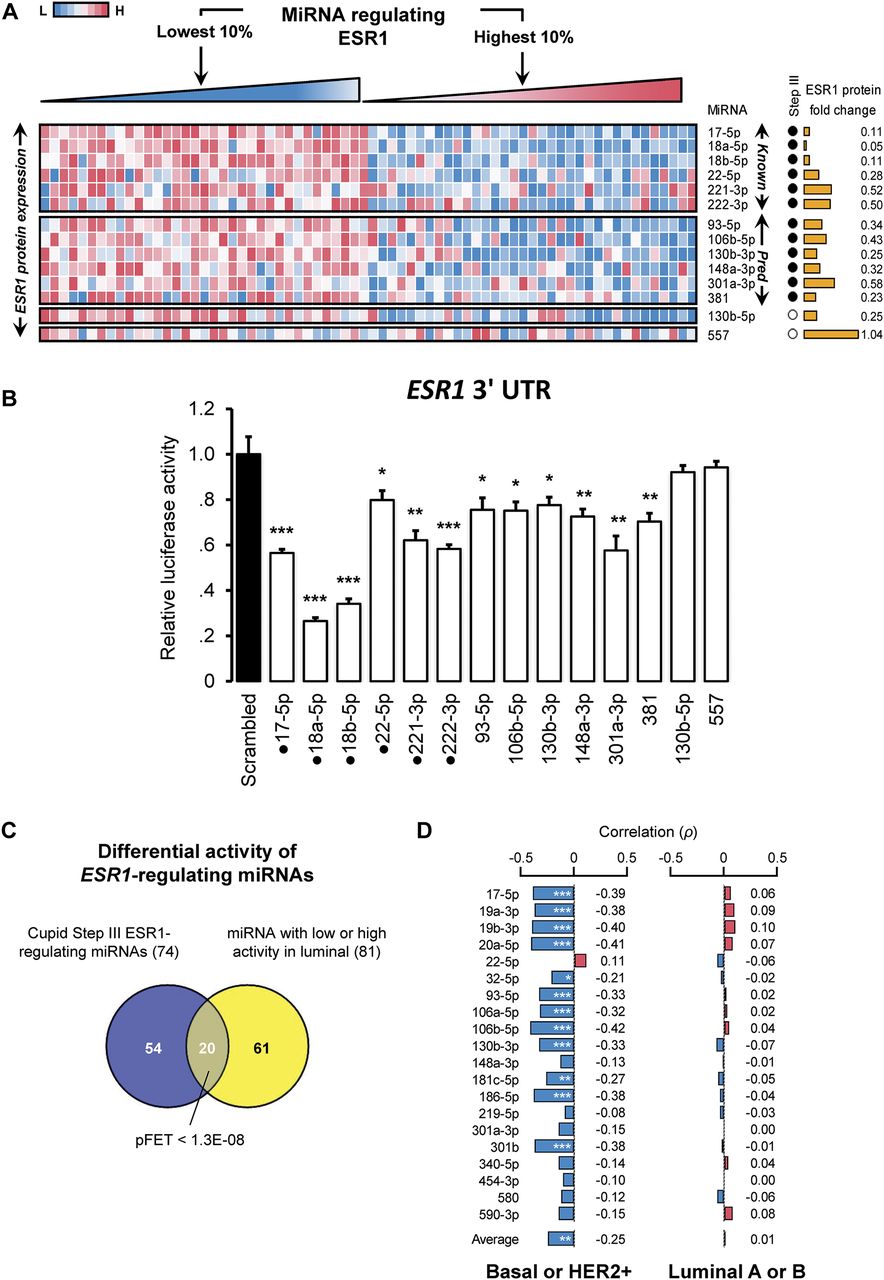
ESR1 expression is anticorrelated with miRNA-regulator expression. (A) ESR1 protein expression in breast cancer tumors is anticorrelated with expression profiles of previously validated (Known) and predicted (Pred) miRNA regulators. ESR1 relative expression in the top and bottom 10% of tumors ranked based on the intensity of the expression of each miRNA; each row was ranked independently. miRNAs predicted to mediate ESR1 ceRNA regulation are marked (Step III); also marked is ESR1 protein expression fold change in tumor samples with low versus high expression for each miRNA. Negative controls include miR-557 and miR-130b-5p; miR-130b-5p expression was anticorrelated with ESR1 expression. (B) 3′ UTR luciferase activity fold changes after miRNA mimic transfections; some data replicated from Figure 5. Punctuated mimics correspond to previously validated interactions. (C) miRNAs with low or high activity in luminal breast cancer tumors are enriched for predicted ESR1 regulators (P < 1.3 × 10⁻⁸), and (D) their expression profiles are anticorrelated with ESR1 protein expression in basal-like and HER2-enriched tumors, but not in luminal tumors. Data are represented as mean ± SEM; (*) P < 0.05, (**) P < 0.01, (***) P < 0.001.


