
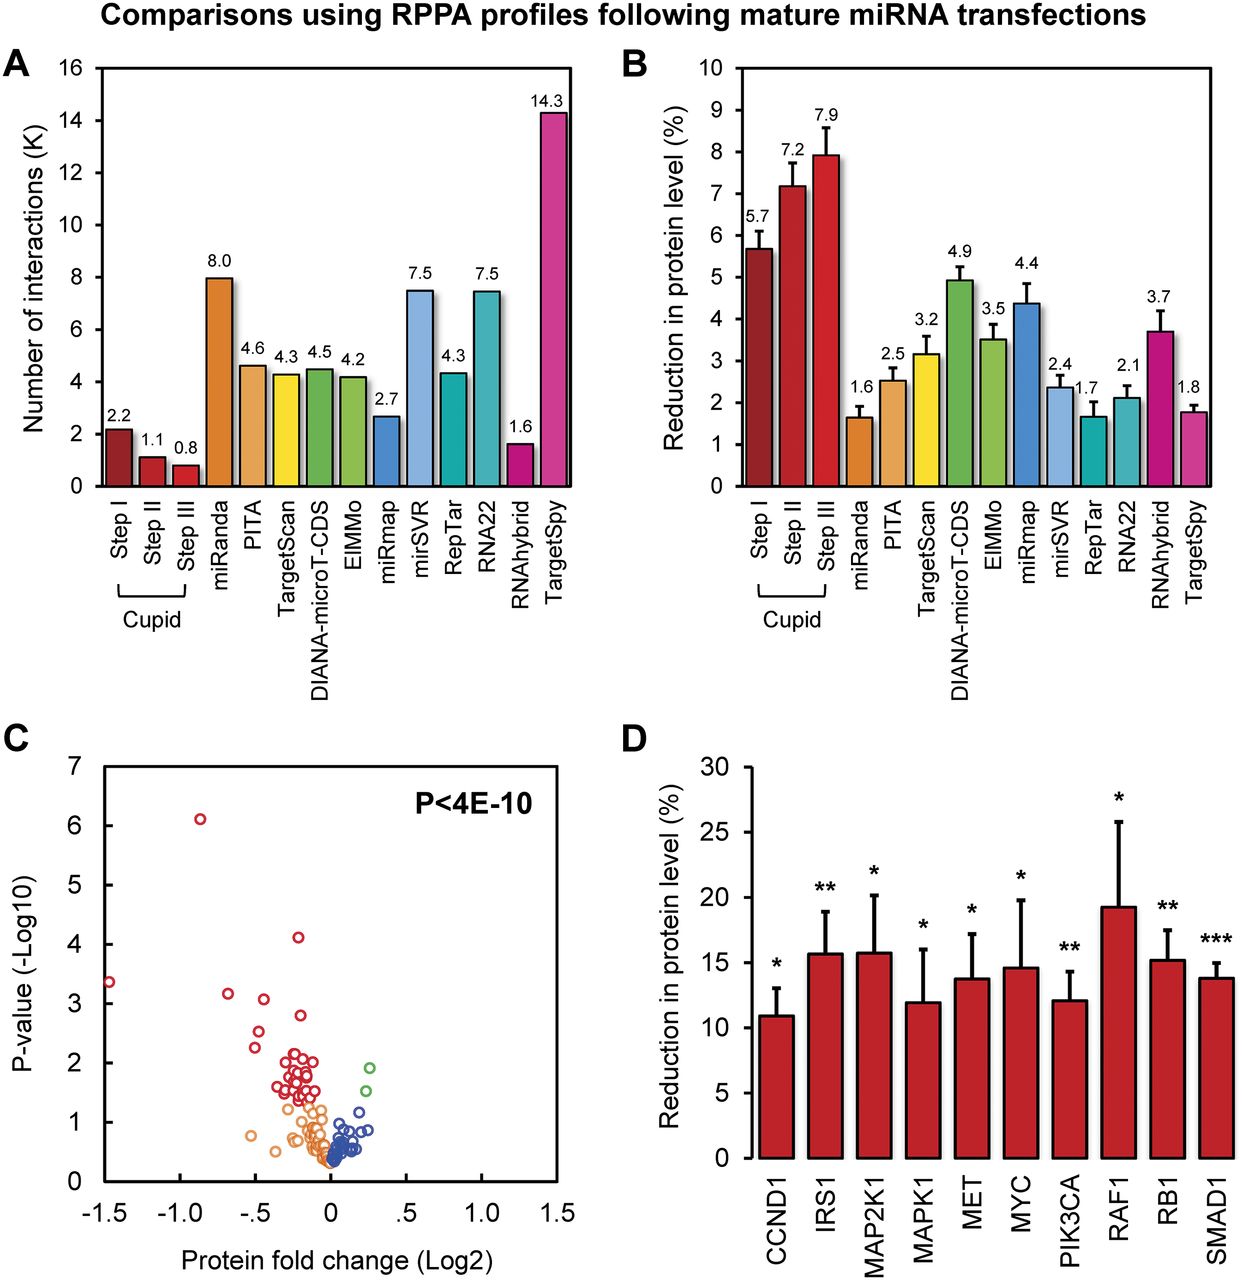
High-throughput perturbation tests using protein-expression profiling. (A) Number of predicted miRNA–target interactions that were tested through miRNA mimic transfection followed by protein-expression profiling. (B) Average reduction in protein level following transfection of predicted miRNA regulators for a panel of target prediction methods. (C) P-values and average protein-expression fold changes after transfection of Cupid-predicted miRNA regulators. In total, considering expression estimates made with 117 antibodies, 34 reported significant down-regulation P < 0.05, in red), 51 reported down-regulation (orange), 30 reported up-regulation (blue), and two reported significant up-regulation (P < 0.05, in green); a comprehensive significance of P < 4 × 10⁻¹⁰. (D) Estimated average reduction in protein expression levels for known breast cancer regulators from C. Data are represented as mean ± SEM.


