
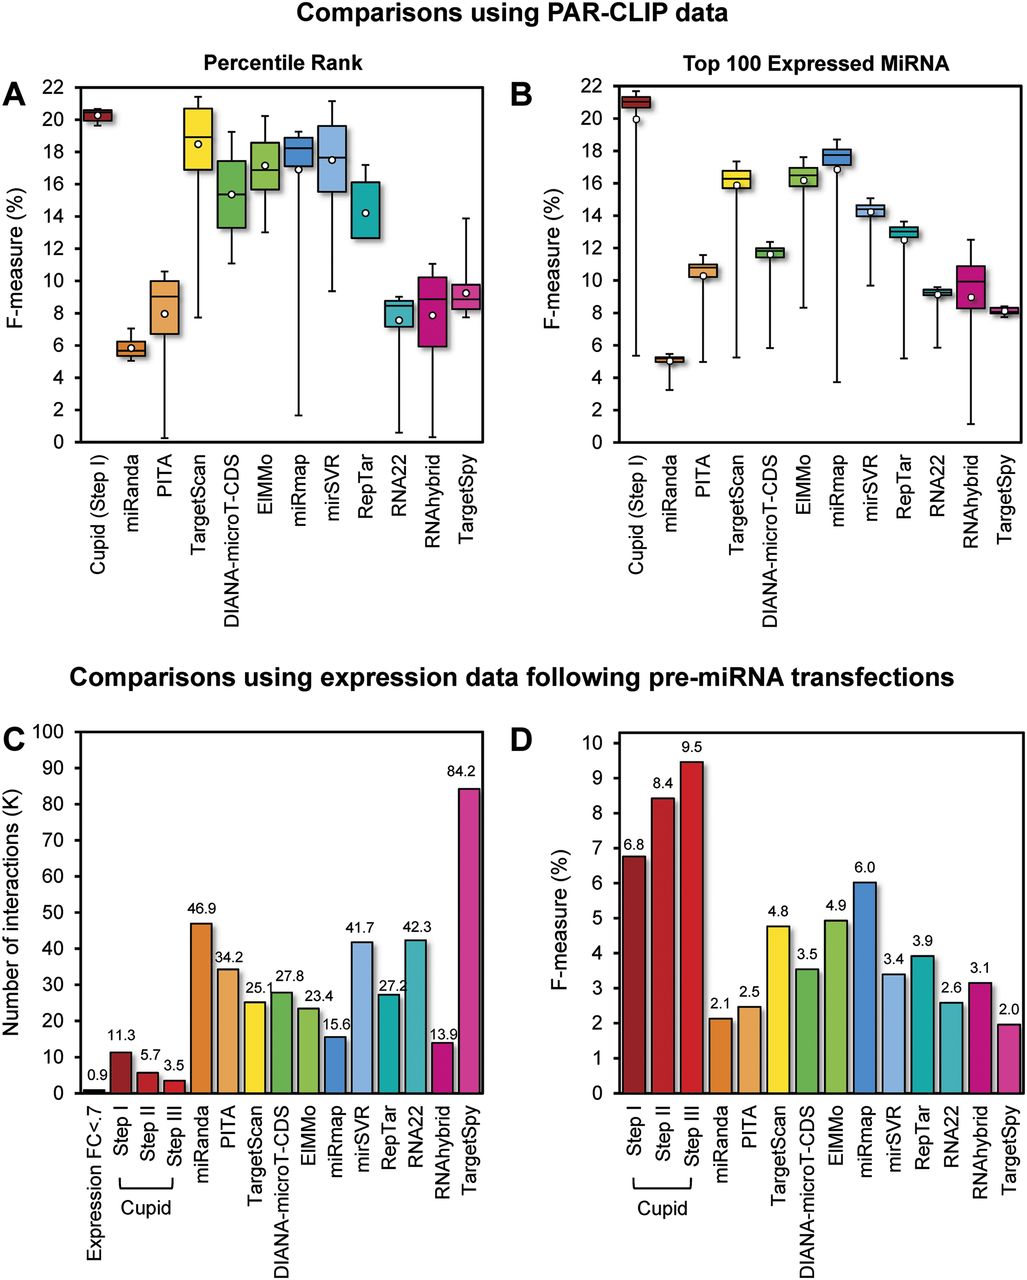
Site and interaction prediction. (A) miRNA-binding-site predictive accuracy estimates for a panel of target prediction methods are given as cumulative distributions across ranks of predicted miRNA-binding-site scores, starting from the top scoring 1% to all predicted sites. Average, upper, and lower quintiles, and the range of the harmonic mean of precision and recall (F-measure) are shown; precision is the fraction of sites that overlap crosslink-centered regions (CCRs) identified in AGO PAR-CLIP experiments relative to the total number of predicted sites, and recall is the number of CCRs overlapping predicted sites relative to the total number of CCRs. (B) Cumulative distributions across the highest expressed miRNAs, from highest expressed to top 100 highest expressed in HEK293 cells, of predicted binding sites that coincide with CCRs. (C) Number of predicted miRNA–target interactions that were tested through pre-miRNA transfections in MCF7 or MDA-MB-231 for a panel of target-prediction methods, and (D) their predictive ability over target mRNA down-regulation.


