
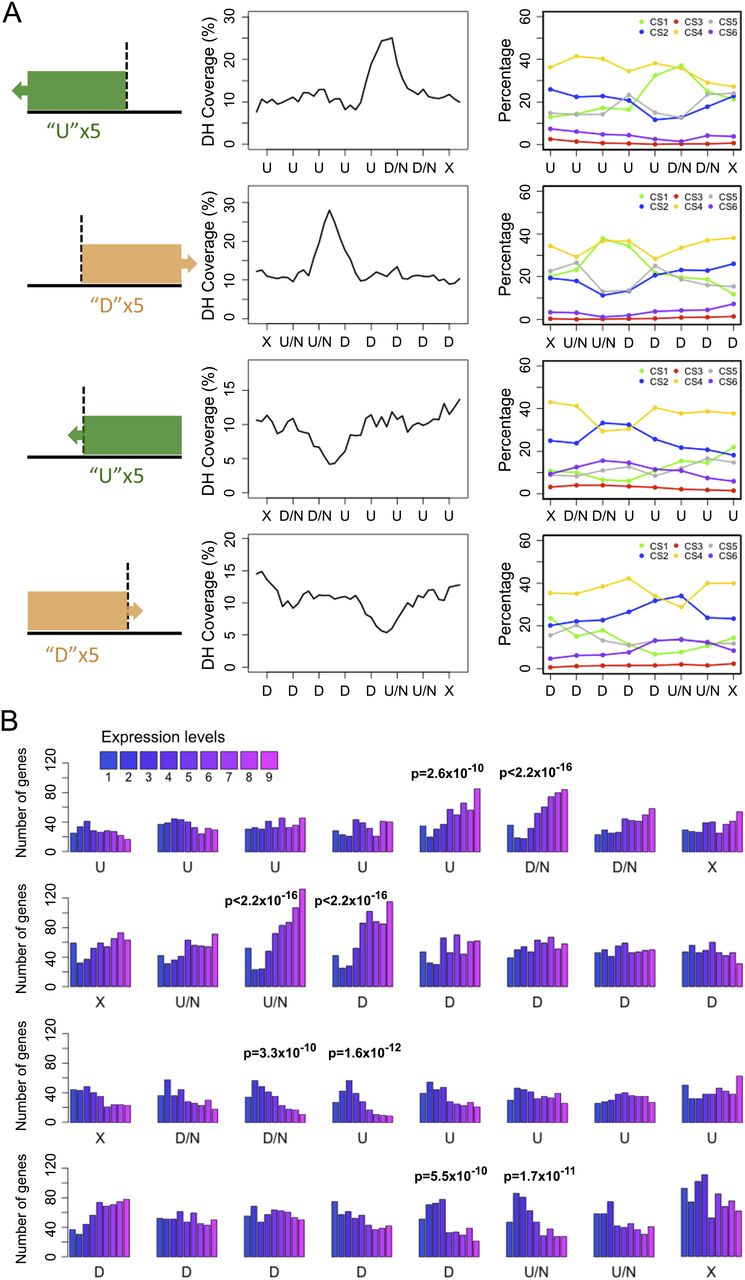
Figure 6.
TAD-boundary-like and TAD-interior-like regions in the A. thaliana genome. (A) DNase I hypersensitive sites and CS. The cartoon on the left shows how a stretch of bins marked “U” or “D” is aligned with respect to the one marking either the start or the end of the pattern (highlighted with a vertical dotted line). (B) Genes ranked by expression level around TAD-boundary-like (top two rows) and TAD-interior-like regions (bottom two rows). Each row represents regions with bins of specific HMM state sequence. See figure legend of Figure 5B–D for other labels.


