
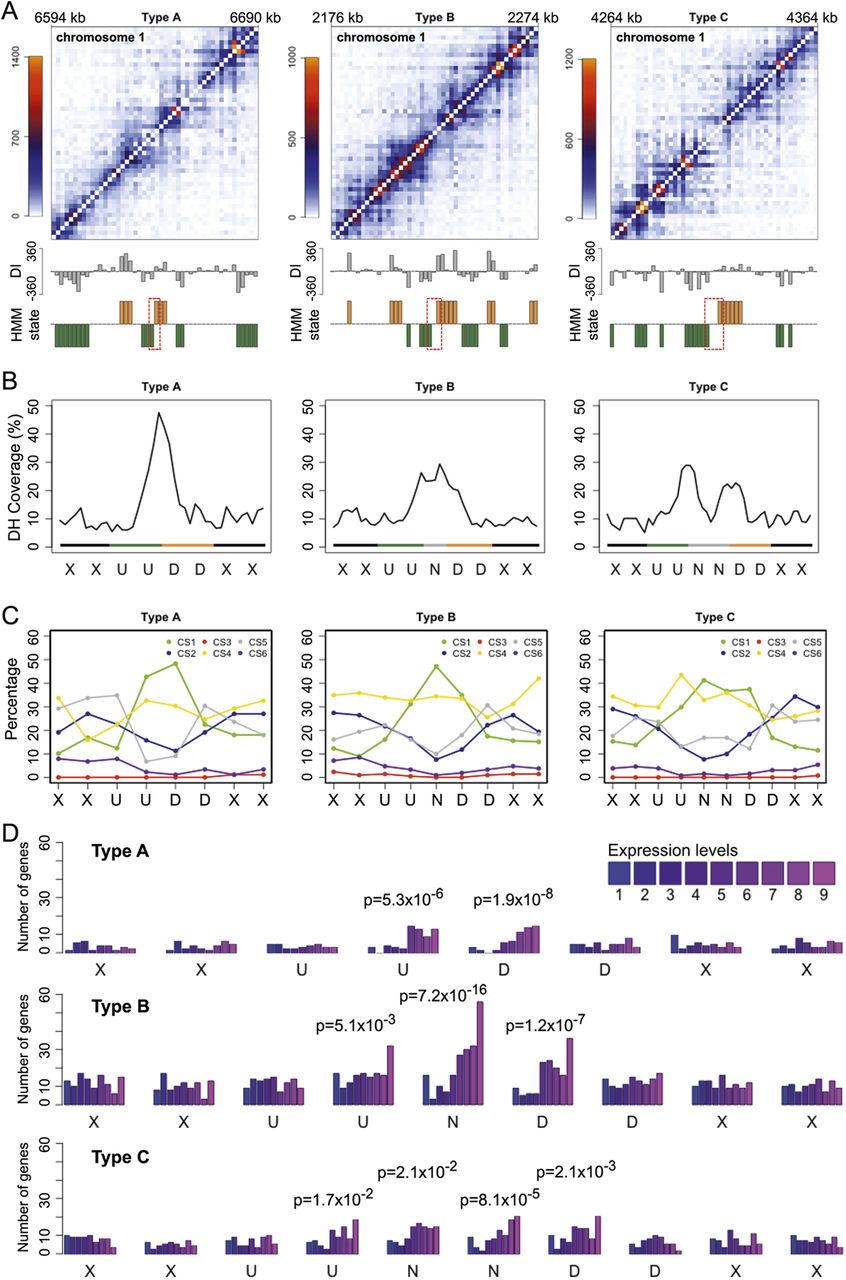
Insulator-like regions in the A. thaliana genome. (A) Examples of each type of insulator-like region, which are placed at the center of the Hi-C map details. Directionality index (DI) and HMM state are shown at the bottom. Positive and negative DI values indicate bins with stronger-than-expected interactions with downstream and upstream regions. Orange indicates downstream and green upstream bias, and the dashed boxes insulator-like regions. (B) DNase I hypersensitive sites (DH) around insulator-like regions. Coverage means the average percentage of each 500-bp bin annotated with such a feature. “U” and “D” bins have biased interactions with upstream and downstream regions, while “N” bins have no directionality bias. “X” indicates bins with any type of HMM state. (C) CS annotation of bins around insulator-like regions. (D) Distribution of genes by expression level around insulator-like regions. For bins from insulator-like regions, the P-values indicate the significance of change in expression level distribution from Cramér-von Mises tests. For C and D, the HMM state of bins are labeled as in B. See Supplemental Figure 18B for categorization of expression levels.


