
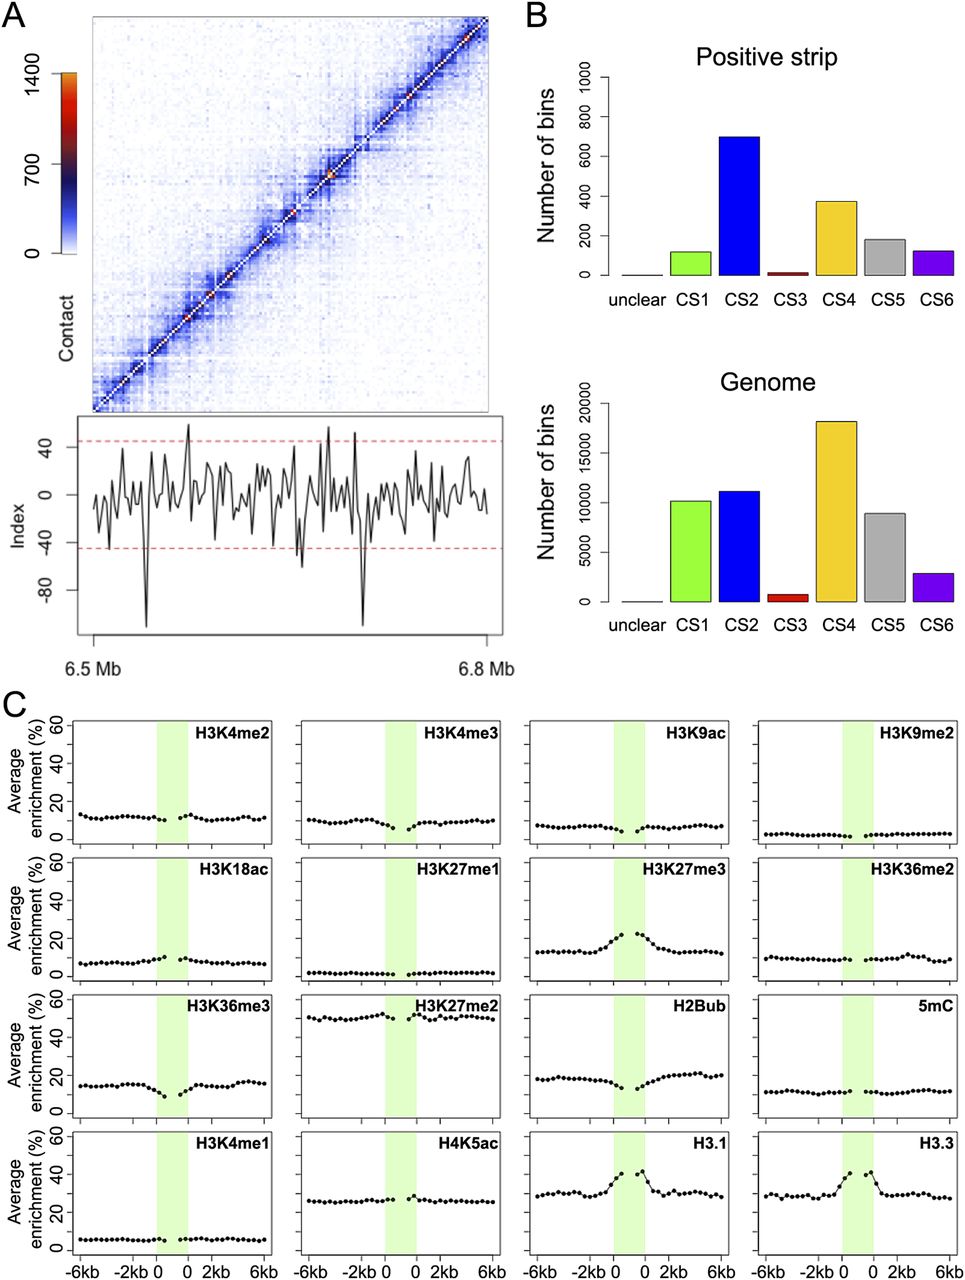
Figure 4.
Genomic features associated with local strips. (A) Hi-C map of a genomic region from Chromosome 1. Index used to quantify local contrast is plotted below. Red dashed lines depict thresholds for calling strips. (B) Annotation of bins forming positive strips by CS. (C) Epigenetic marks around positive strips. Average enrichment means the percentage of each 400-bp region claimed as enriched for the respective epigenetic mark.


