
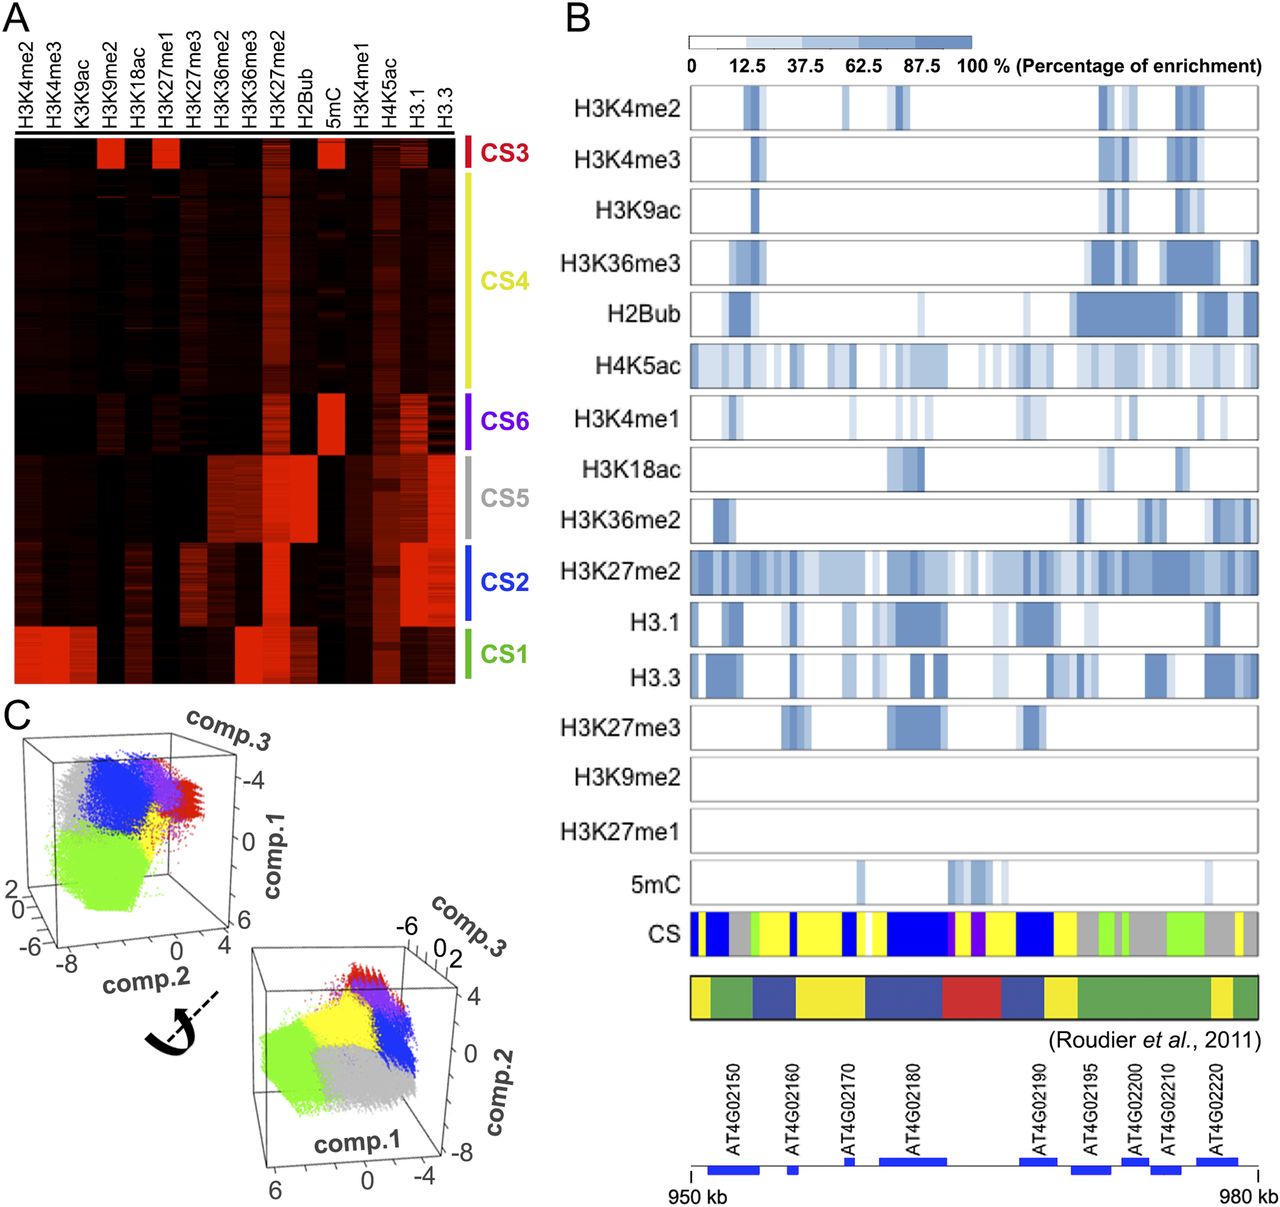
Figure 2.
Classification of the A. thaliana epigenome at 400-bp resolution. (A) Identification of chromatin states (CS). CS1–4 are according to Roudier et al. (2011), who used 12 epigenetic data sets that partially overlap with the 16 data sets used here. CS5 (gray) is related to CS1 (green) and CS6 (purple) to CS3 (red). (B) Enrichment of 16 epigenetic marks and chromatin state classification in 400-bp bins in a region from Chromosome 4. Comparison of CS classification in this study and that by Roudier et al. (2011) is also shown. (C) Visualization of classified bins with the first three principal components. Bins are colored according to their CS groups.


