
Figure 1.
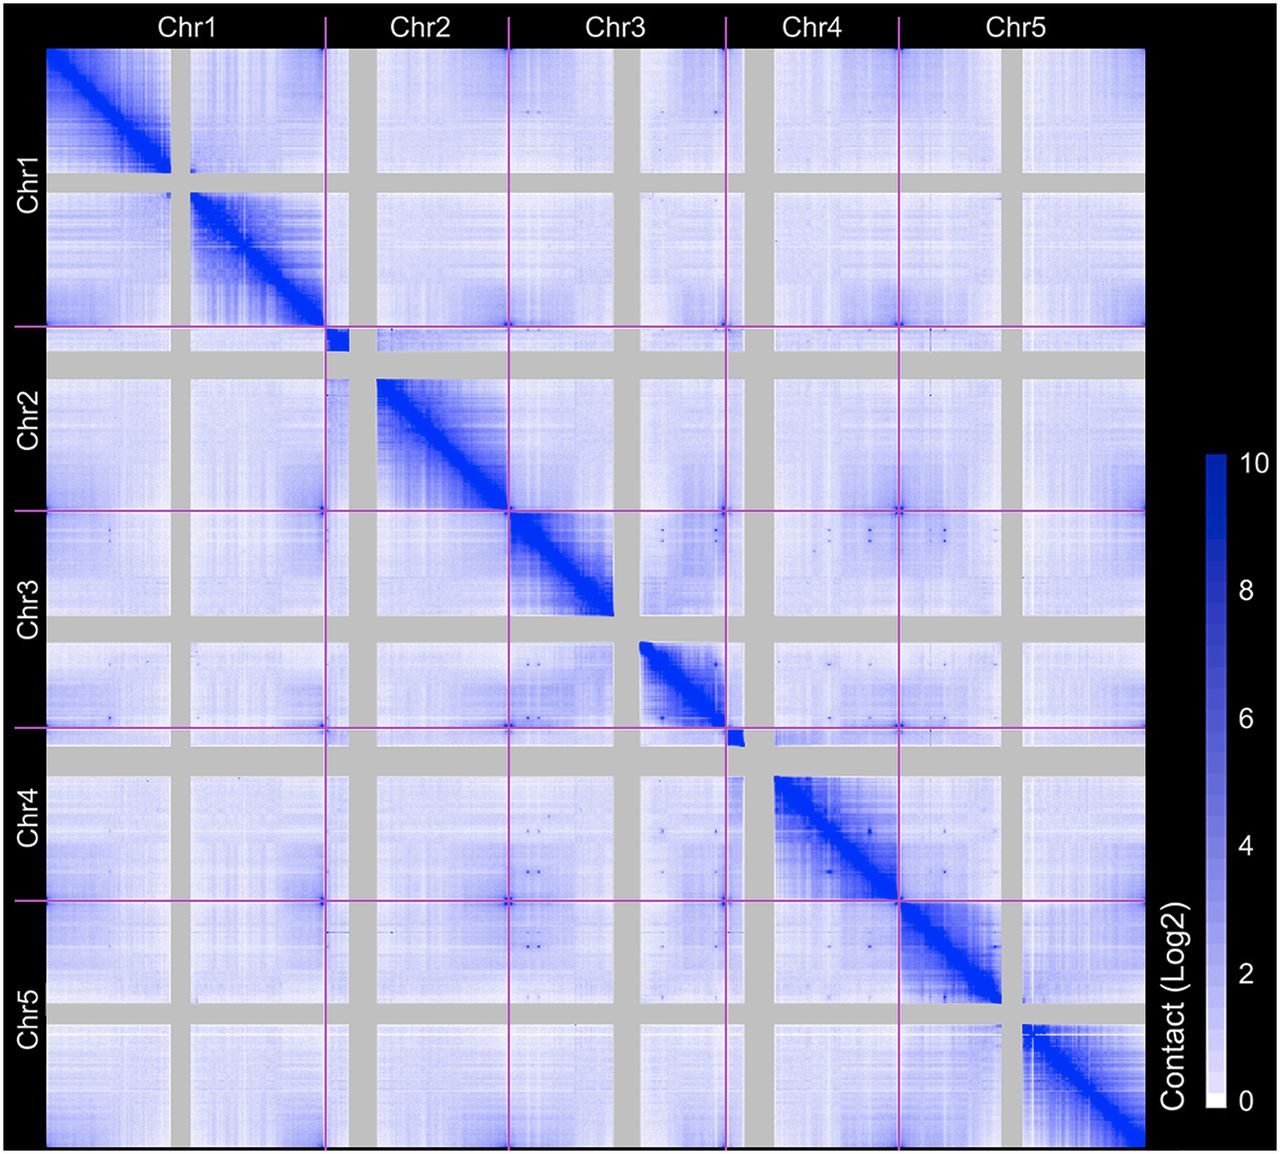
Genome-wide interaction map of A. thaliana at 20-kb resolution. Elements represent normalized contact strength. Centromeric regions are masked.
(Downloading may take up to 30 seconds. If the slide opens in your browser, select File -> Save As to save it.)
Click on image to view larger version.
Genome-wide interaction map of A. thaliana at 20-kb resolution. Elements represent normalized contact strength. Centromeric regions are masked.
 CiteULike
 Delicious
 Digg
Digg Facebook
 Google+
 Reddit
 Twitter
