
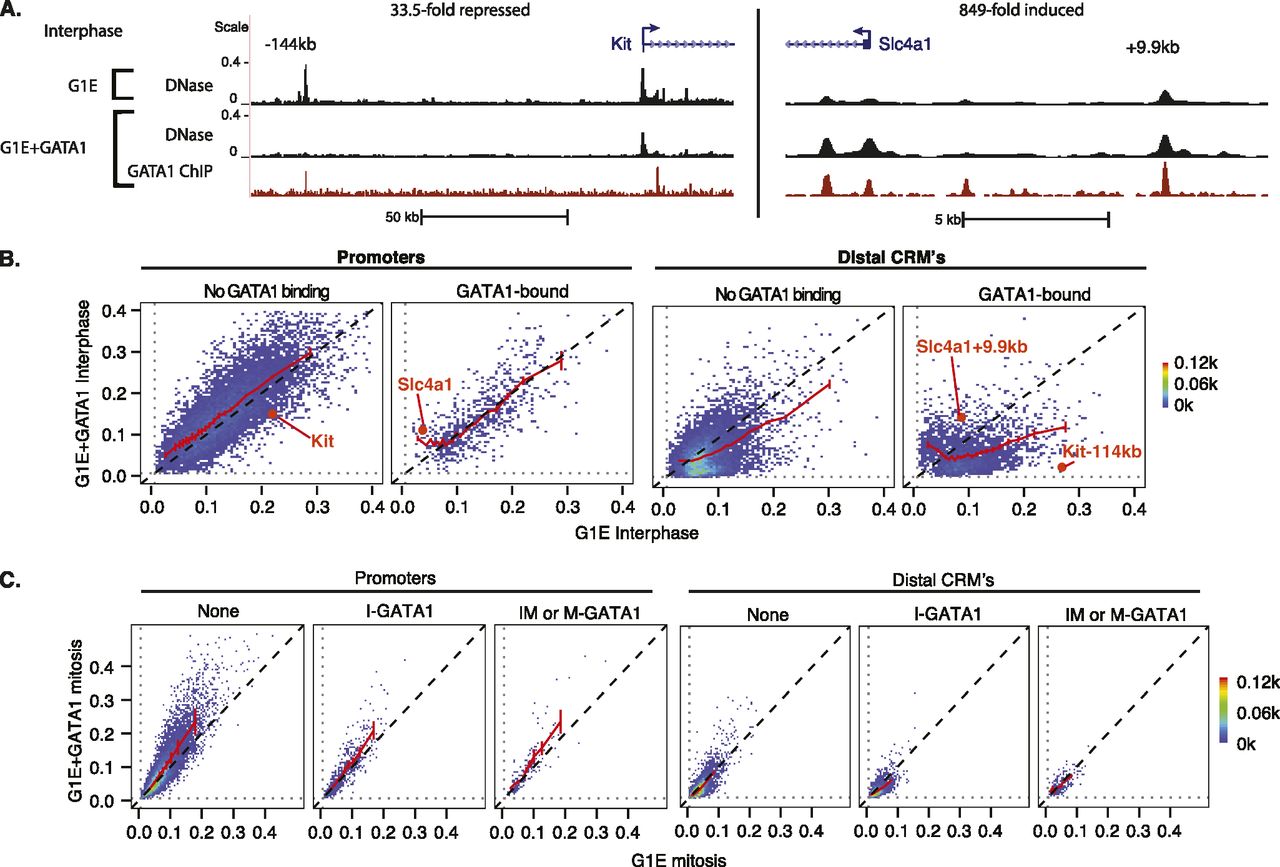
Dynamics of interphase and mitotic chromatin accessibility during GATA1-driven erythroid maturation. (A) Browser track views of DNase accessibility and GATA1 ChIP-seq profiles in interphase, with the fold change in mRNA levels from G1E to G1E + GATA1 indicated at the top. (B) Interphase accessibility dynamics of DNase peaks in G1E versus G1E + GATA1 are presented as scatterplots (binned 2D density plots), grouped by promoter versus distal CRMs, and by overlap with GATA1 binding sites. Graphing conventions are the same as in Figure 3, with error bars denoting SEM of biological replicates (n = 3) for moving means. Promoters and distal regulatory sites associated with GATA1-repressed (Kit) and GATA1-induced Slc4a1 loci shown in A are highlighted. (C) Scatterplots (binned 2D density plots) of G1E mitotic accessibility versus G1E + GATA1 mitotic accessibility of DNase peaks are shown, grouped by overlap with GATA1 binding sites in interphase only (I-GATA1), interphase and mitosis (IM-GATA1), or mitosis only (M-GATA1). Graph conventions are similar to B.


