
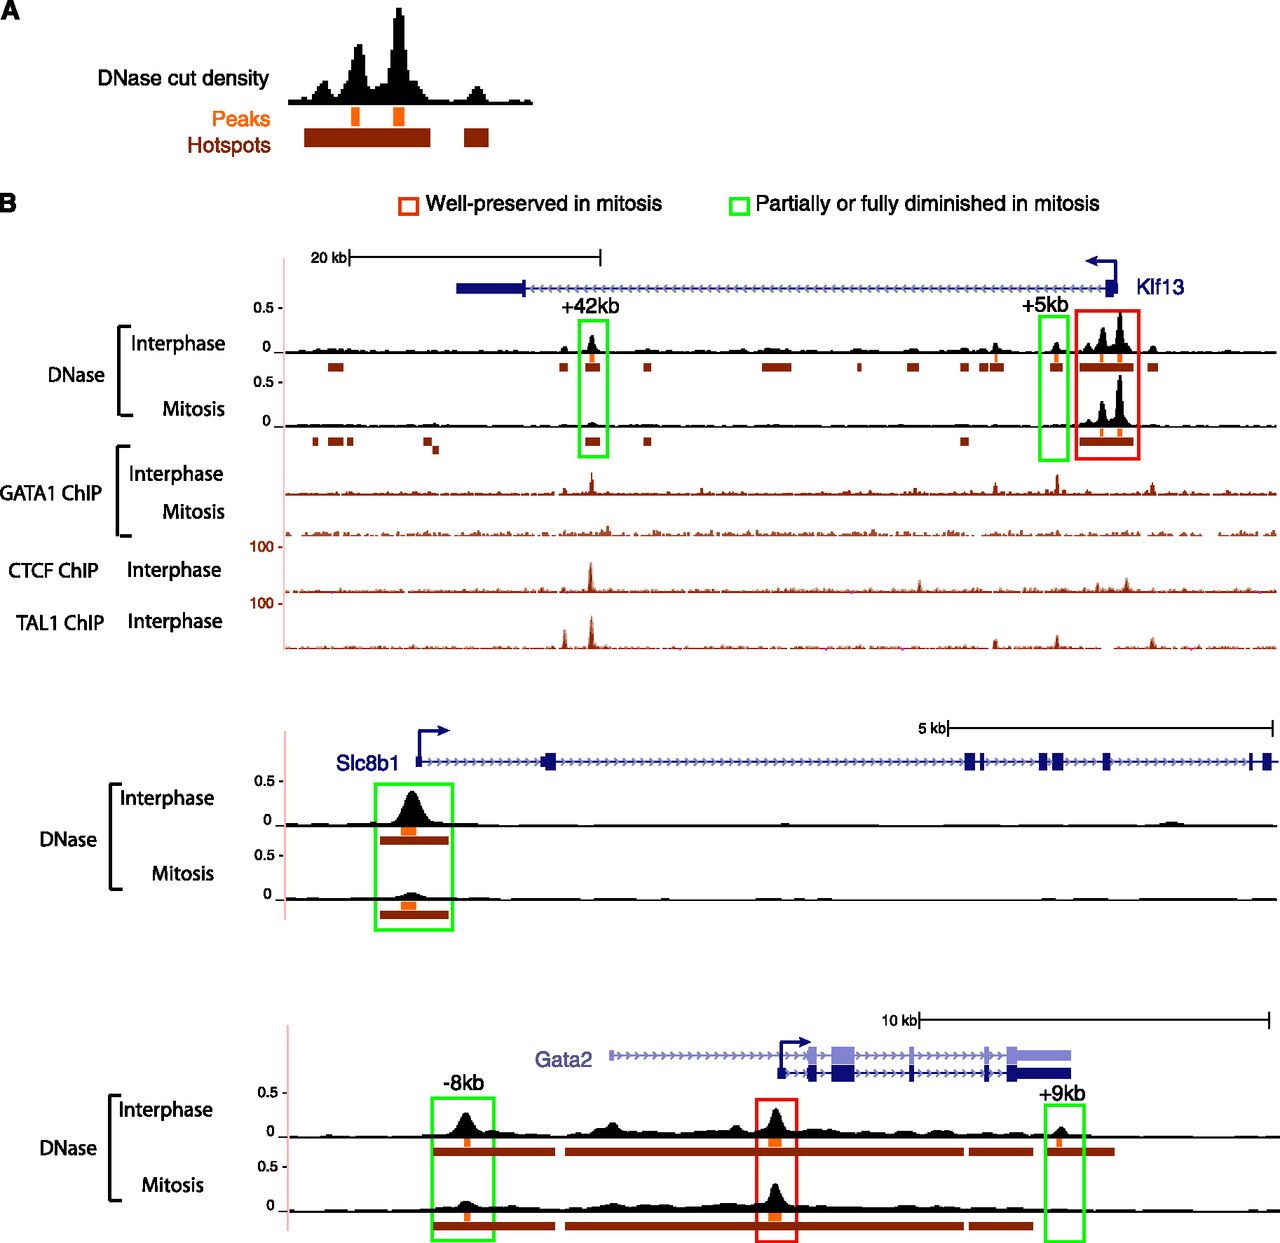
Individual sites display diverse patterns of interphase-to-mitosis dynamics in chromatin accessibility. (A) Example of DNase hotspots and peaks. (B) G1E + GATA1 DNase cut density profiles at the Gata2, Slc8b1, and Klf13 loci are shown to illustrate their spatial patterns. Broad versus narrow sensitivity patterns are captured by the hotspots (brown bars) and peaks (orange bars), respectively, as defined in the main text and in Supplemental Methods. Note that individual sites can retain very little (green boxes), or virtually all (red boxes) of their accessibility in mitosis. A number of different patterns are also shown for the Klf13 locus, for which ChIP-seq tracks for GATA1 (interphase and mitosis), CTCF (Wu et al. 2011), and TAL1 are also shown to illustrate colocalization of their binding sites with DNase peaks.


