
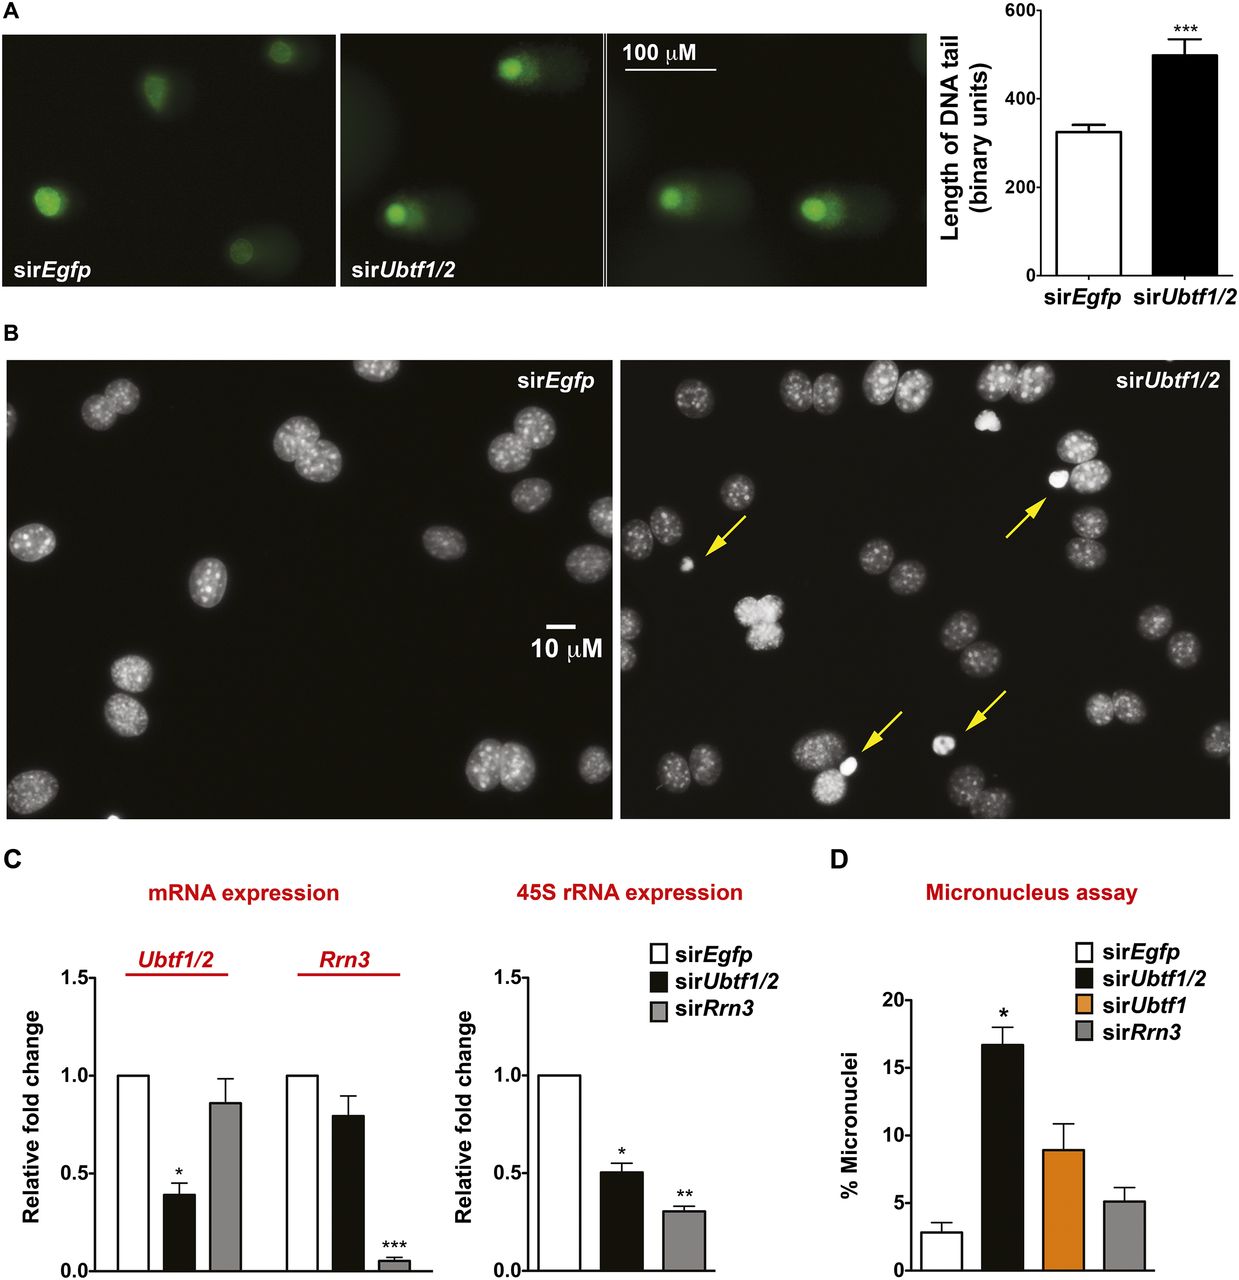
Ubtf1/2 knockdown leads to DNA damage and genomic instability. (A) NIH3T3 cells were transfected with sirEgfp or sirUbtf1/2#1 for 48 h and DNA damage was measured by comet assay. Representative images of SYBR green-stained DNA of sirEgfp control cells, showing undamaged and supercoiled DNA remaining within the nuclear membrane, while in sirUbtf1/2#1 cells, denatured DNA fragments migrate out from the nucleus in a comet tail. The tail length for ∼50 nuclei for each sample from two independent experiments was measured using metamorph software. The graph on the right panel represents Ave ± SEM. (*) P-value < 0.05 compared to sirEgfp control. (B) Ubtf1/2 knockdown leads to abnormal mitosis as measured by the CBMN assay. NIH3T3 cells transfected with sirEgfp or sirUbtf1/2#1 were incubated for 24 h, then Cytochalasin B, an inhibitor of cytokinesis, was added at 3 µg/mL for a further 24 h. DAPI staining was then performed and percentages of binucleated cells exhibiting micronuclei were scored (yellow arrows) (n = 3; Ave ± SEM). (*) P < 0.05. (C) Forty-eight hours after transfecting NIH3T3 cells with sirEgfp, sirUbtf1/2#1, or sirRrn3, total RNA was extracted, and Ubtf1/2 mRNA, Rrn3 mRNA, and 45S rRNA precursor levels were determined by reverse transcription qPCR. mRNA levels were normalized to B2m mRNA and expressed as fold change relative to the sirEgfp control (n = 3; Ave ± SEM). (*) P-value < 0.05, (**) P-value < 0.01, (***) P-value < 0.001, compared to corresponding sirEgfp controls. (D) NIH3T3 cells were transfected with siRNA oligos as indicated, and the CBMN assay was performed as described in B (n = 3). Approximately 100 cells were counted in each experiment and percentages of binucleated cells exhibiting micronuclei were scored (Ave ± SEM). (*) P-value < 0.05 compared to sirEgfp control.


