
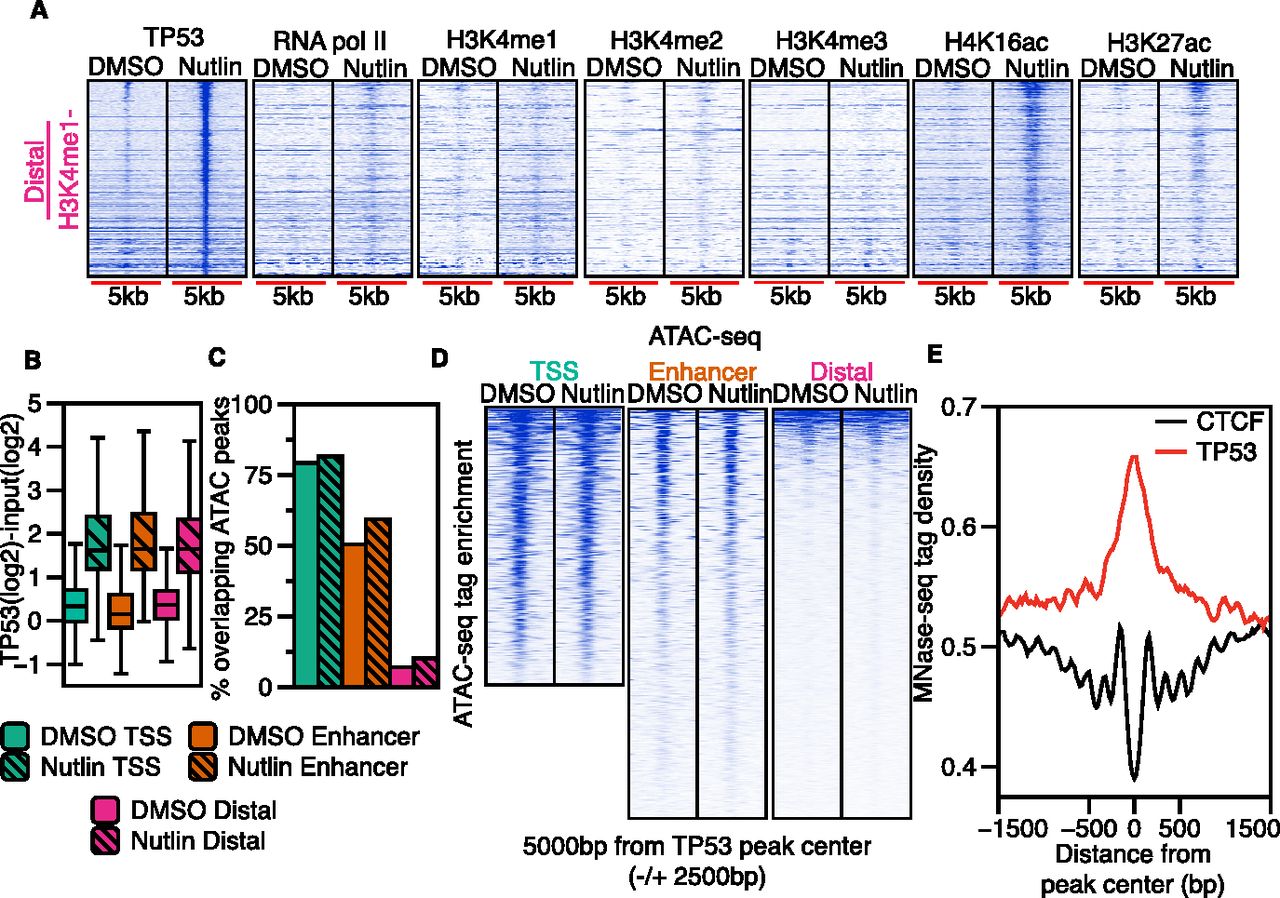
Distal TP53 peaks lie within regions of inaccessible chromatin and display dynamic histone acetylation. (A) Heatmap plots of TP53, RNA pol II, H3K4me3, H3K4me1, H3K27ac, and H4K16ac enrichment (±2500 bp from the TP53 peak center) for the distal (H3K4me1−/H3K4me3−) TP53 peak type for DMSO and nutlin. (B) Boxplot analysis of the input-subtracted TP53 enrichment (±750 bp from TP53 peak center) for TSS (green), enhancer (orange), or distal (pink) TP53 peaks in the DMSO and nutlin conditions. (C) Analysis of the fraction of TSS (green), enhancer (orange), or distal (pink) TP53 peaks overlapping significantly enriched (MACS-defined) ATAC-seq peaks for the DMSO (solid color) and nutlin (striped color) treatment conditions. (D) Heatmap of ATAC-seq enrichment (normalized to 1 × 10⁻⁷ reads) over a 5000-bp window (±2500 bp from TP53 peak center) at TP53 peaks of each class (TSS, enhancer, distal) for the DMSO and nutlin-treated conditions. (E) Average MNase-seq tag density (±750 bp from TP53 peak center) from all nutlin-induced TP53 binding sites and CTCF binding sites.


