
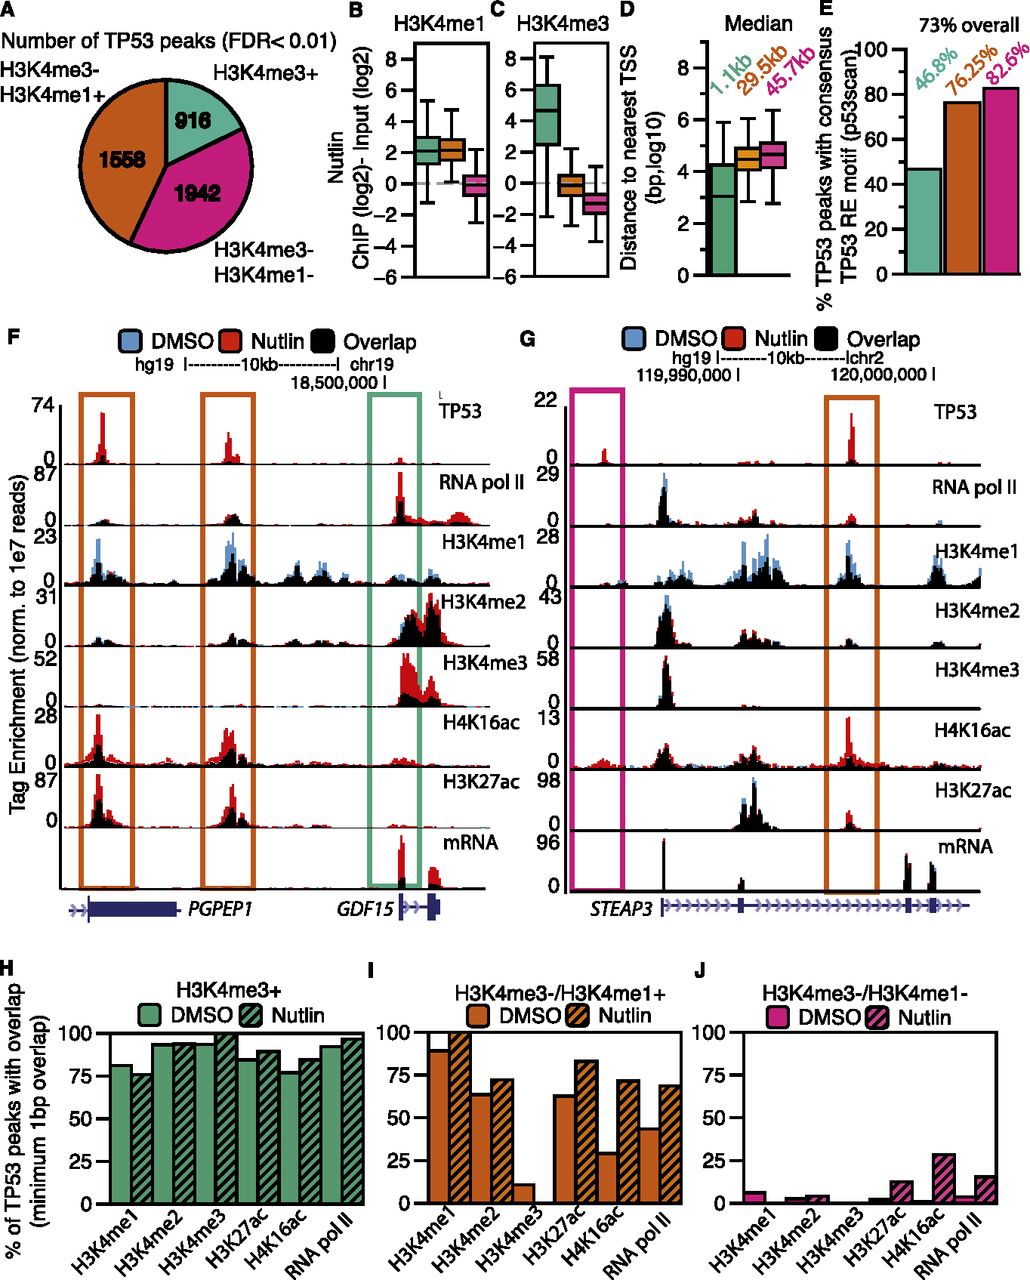
TP53 interacts with the genome at three distinct categories of binding sites defined by a dynamic local chromatin environment. (A) The classification of TP53 peaks based on their overlap with significantly enriched regions of H3K4me3 or H3K4me1. (B,C) Box plot analyses of H3K4me1 (B) and H3K4me3 (C) enrichment at each class of TP53 binding site (TP53 peak center ±750 bp). (D) Distances of each class of TP53 peak to the nearest TSS of a RefSeq gene. (E) Percentage of TP53 motifs within each category of TP53 peak. (F,G) Example UCSC Genome Browser track view of the GDF15 locus (F) and the STEAP3 locus (G), depicting the three classes of TP53 peaks. Tracks for the DMSO and nutlin treatment condition are shown in blue and red, respectively, with regions of overlap depicted in black. The y-axis is scaled to the maximum intensity for each set of data. Different classes of peak types are boxed, corresponding to the class of peak as in Figure 2A. (H–J) The percent of TP53 peaks (nutlin treatment) overlapping with significantly enriched regions of chromatin and RNA pol II in the DMSO (solid) and nutlin (striped) treatment conditions for (H) H3K4me3+ (TSS); (I) H3K4me3−/H3K4me1+ (enhancer); and (J) H3K4me3−/H3K4me1− (distal) TP53 peaks.


