
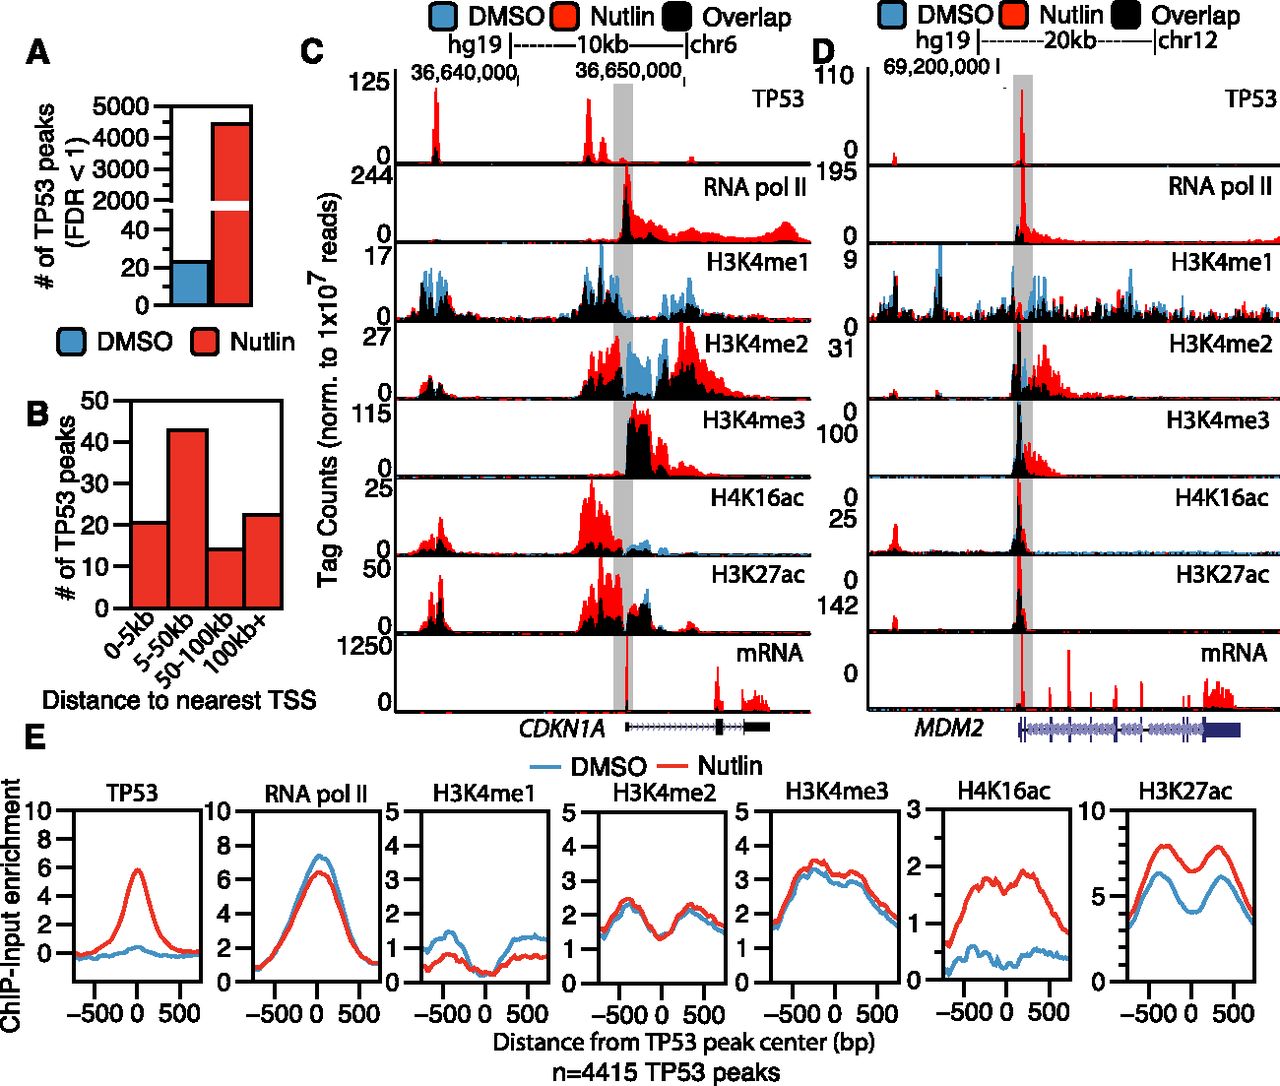
Epigenomic analysis of TP53 activation in primary human fibroblasts. (A) The number of significantly enriched TP53 peaks (versus input, defined by MACS identified by ChIP-seq in IMR90 primary human lung fibroblasts after treatment with DMSO [blue] or nutlin [red]; 5 μM final in DMSO) for 6 h. (B) The percentage of TP53 peaks after nutlin treatment within varying distances to the nearest TSS of a RefSeq gene. (C,D) UCSC Genome Browser track view of TP53, RNA pol II, poly(A)+ selected RNA (mRNA), H3K4me1, H3K4me3, H4K16ac, and H3K27ac at the CDKN1A (C) and MDM2 (D) genes. Tracks for the DMSO and nutlin treatment condition are shown in blue and red, respectively, with regions of overlap depicted in black. The y-axis is scaled to the maximum intensity for each set of data. (E) Enrichment profiles (input subtracted) at TP53 peaks (TP53 peak center ±750 bp) in the DMSO (blue) and nutlin (red) treatment condition for TP53, RNA pol II, H3K4me1, H3K4me2, H3K4me3, H4K16ac, and H3K27ac.


