
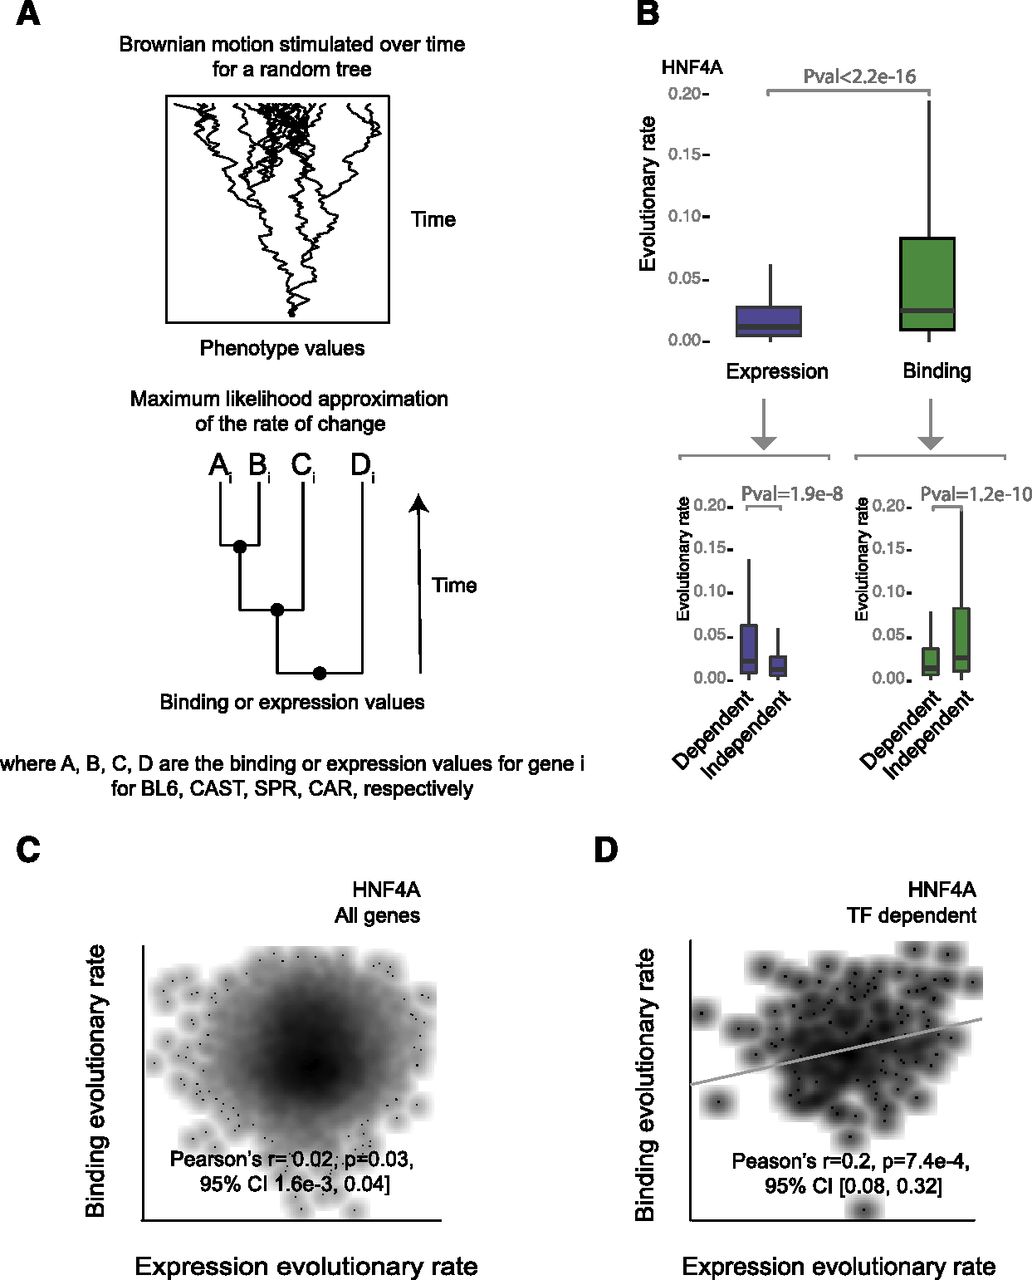
Brownian motion analysis reveals decoupling of TF binding and gene expression evolution rates. (A) A phylogenetic generalized least-squares model based on evolution by Brownian motion was used to estimate the evolutionary rate of binding and expression change. The most likely binding and expression rates for each gene were estimated based on the topology of the phylogeny and the binding intensity and expression values for each species. (B) Boxplots compare the evolutionary rates of binding and expression for HNF4A. Lower boxplots contrast the evolutionary rates for target versus nontarget HNF4A genes separately for binding and expression. (C) Density scatterplots showing the rate of HNF4A binding evolutionary change against gene expression for all genes. Correlation was calculated using Pearson’s method with log-transformed values. (D) Density scatterplots showing the rate of binding evolutionary change against expression for HNF4A TF-dependent and TF-independent genes. Correlation was calculated using Pearson’s method with log-transformed values.


