
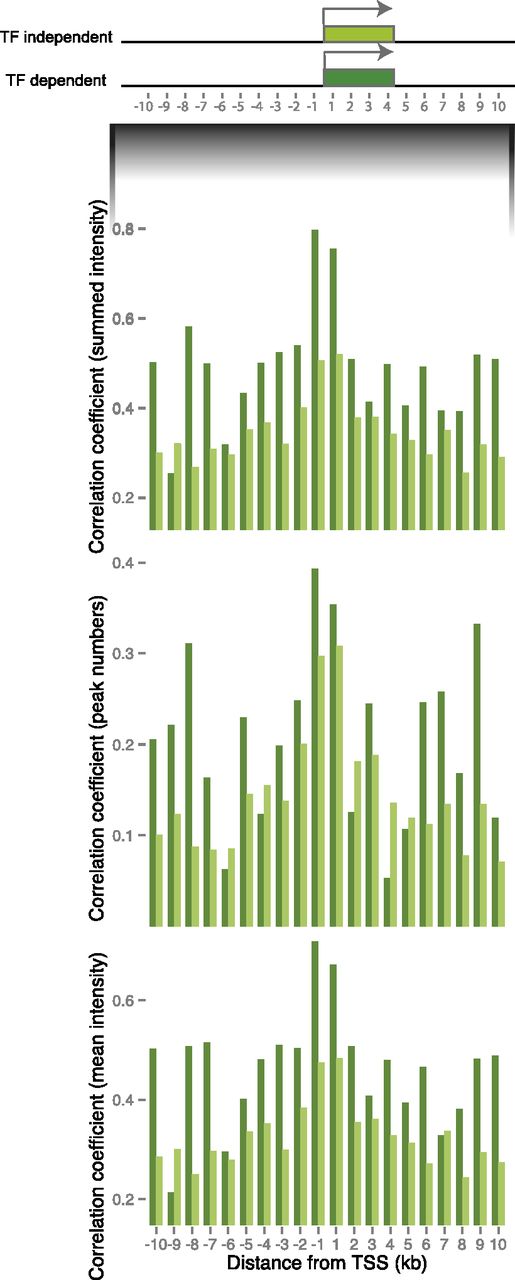
Both peak intensity and total number of peaks are conserved near TF-dependent genes. Spearman’s rho correlation coefficient of summed binding intensities (summation of all peak intensities within binned region), peak counts, and average peak intensities (summed peak intensities divided by the number of peaks in each bin) averaged over BL6 and CAR, CAST and CAR, and SPRET and CAR comparisons. These values are summarized for 1-kb binned distances from TSS for TF-dependent versus TF-independent genes for all three TFs. HNF4A dependent (dark green) and HNF4A independent (light green). For other TFs, see Supplemental Figure S5.


