
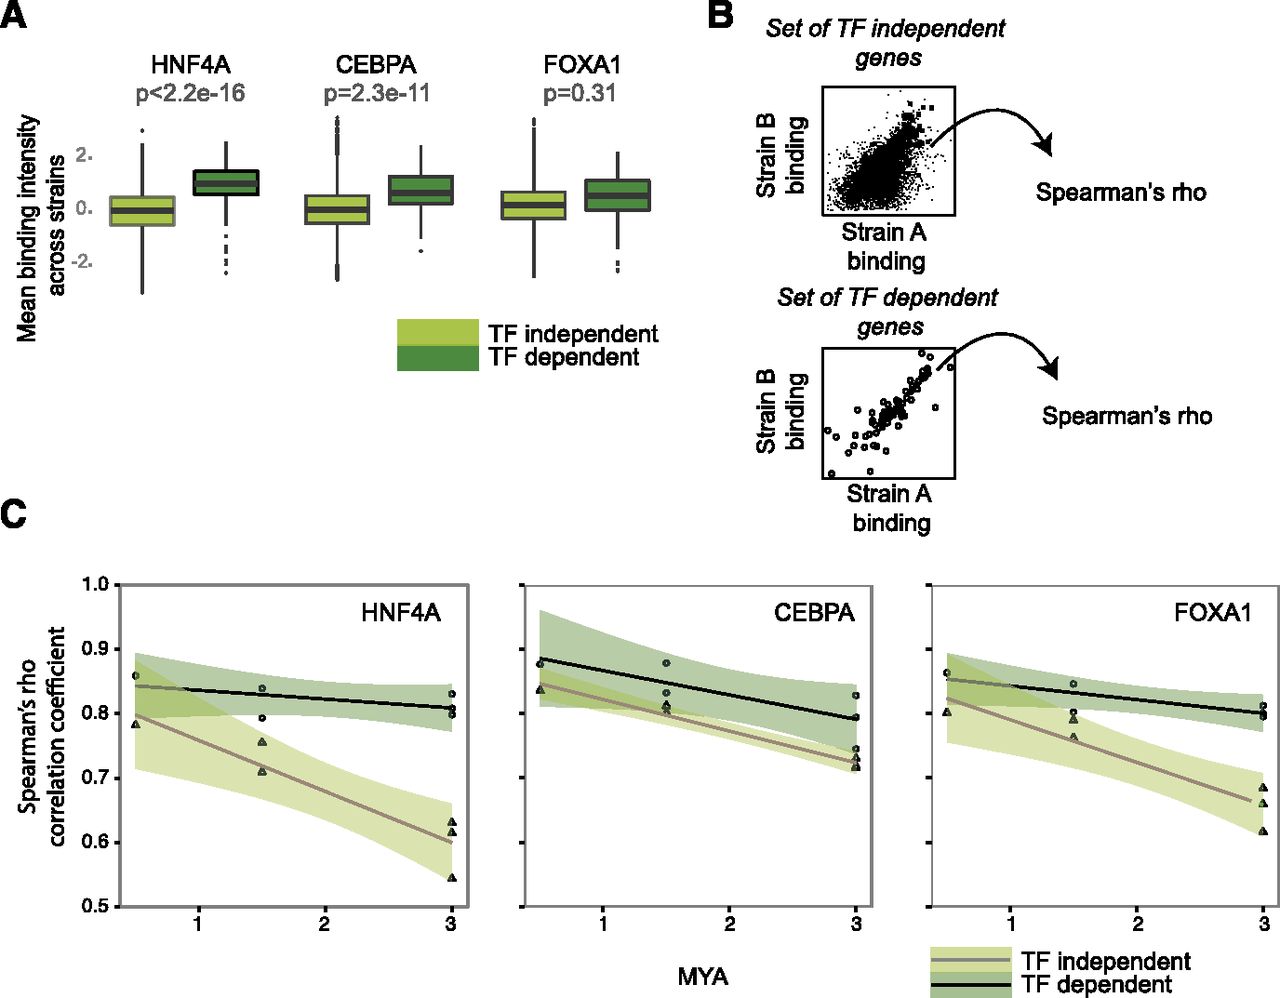
Collective binding intensity is conserved near TF-dependent genes. (A) Boxplots comparing collective binding intensities between TF dependent and TF independent for each TF (values are averaged across species). P-values were calculated using the Mann-Whitney U test. (B) Correlation coefficients (Spearman’s rho) were derived from pairwise comparison of collective binding values between taxa for both TF-dependent and TF-independent genes. (C) Decay of TF binding correlation coefficient over evolutionary time for the three TFs. TF-dependent genes tend to show greater conservation of collective binding intensity compared to TF-independent genes. Shaded areas represent point-wise 95% confidence intervals.


