
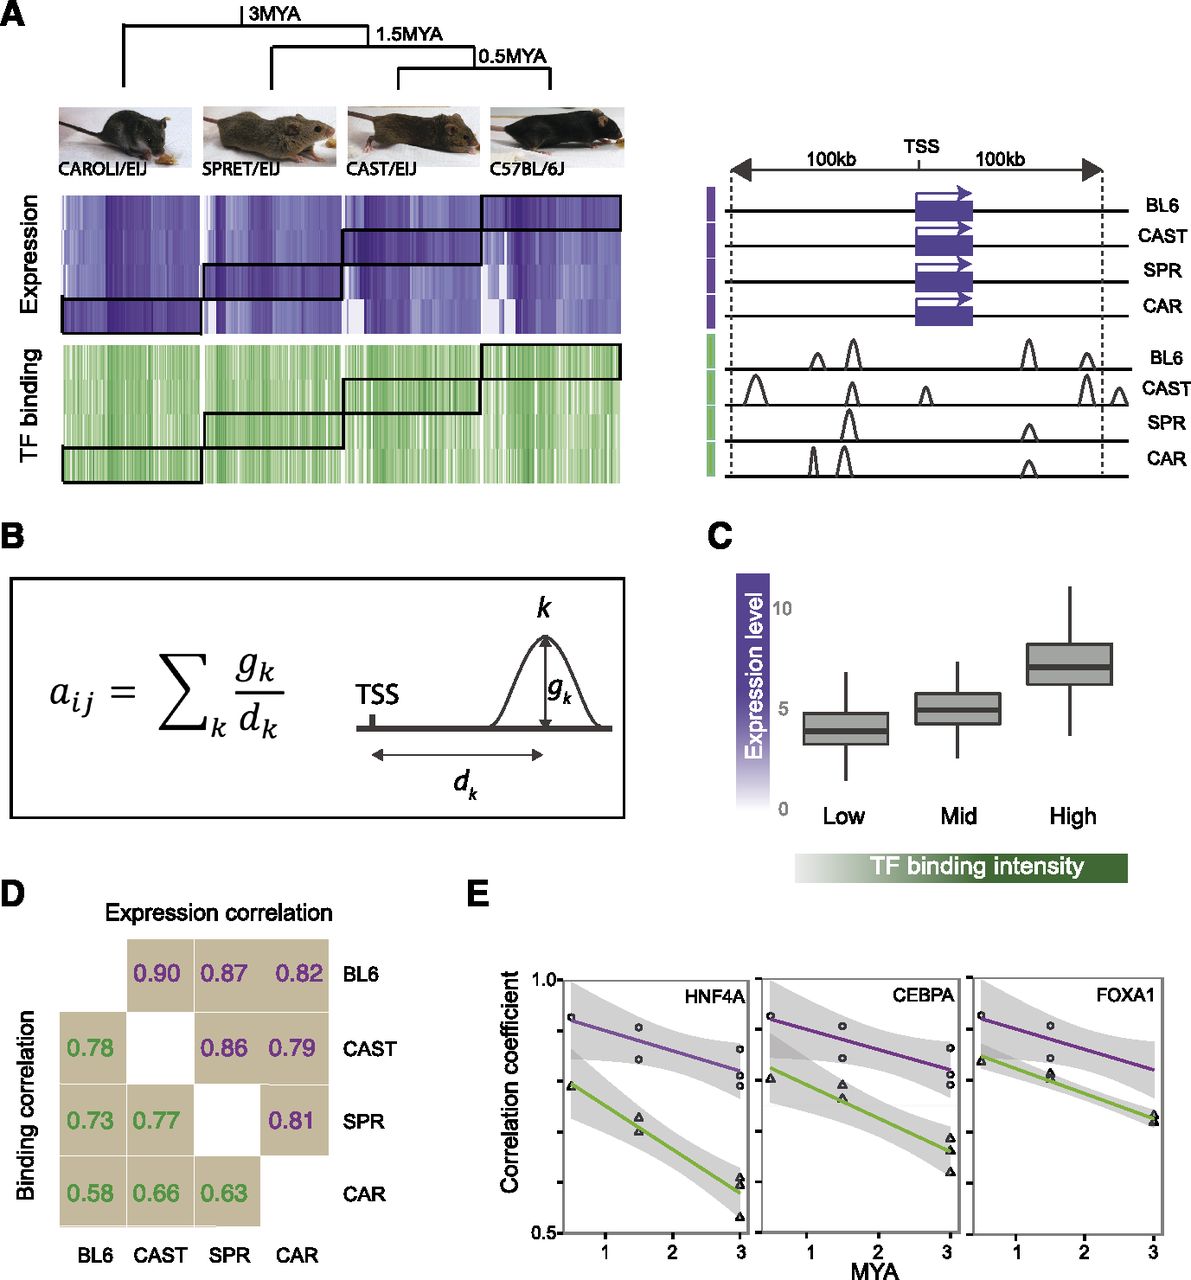
Evolution of transcription factor binding and gene expression between closely related mammals. (A) Overview of lineage-specific relationship of TF binding (green) and gene expression (purple), sorted by gene expression. Darker regions in the heatmap denote higher values of binding and expression. Genes were selected for the heatmap based on differential expression in one lineage versus the others with expression values in other lineages also shown. Corresponding binding values in the proximity of each gene are displayed and illustrate the noisy relationship between binding and expression. (B) Description of the method used for calculating a binding score for each gene (i) for each TF (j). Each peak (k) was weighted by its distance from any TSS within 100 kb. For each gene, weighted peak intensities for all peaks within 100 kb of either direction from the TSS were summed. (C) High expressed genes are more highly occupied by TFs. (D) Spearman’s rho for pairwise correlation of expression and binding between mouse species. (E) Decay rate of correlation coefficient for binding and expression. Shaded areas represent point-wise 95% confidence intervals.


