
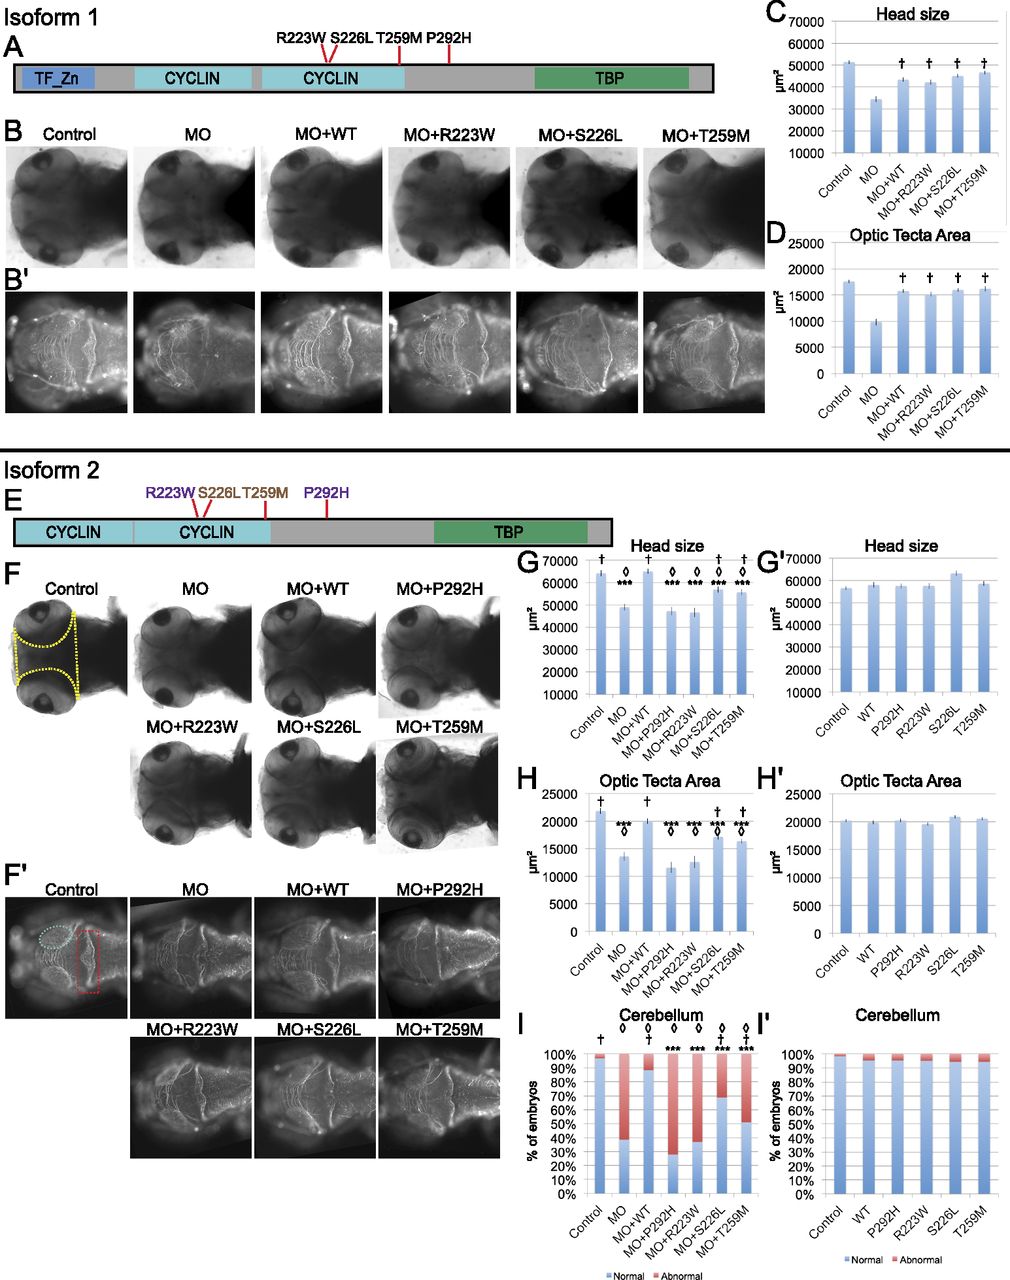
Functional annotation of variants in isoforms 1 and 2 of BRF1 and its effects on the head size, optic tectum size, and cerebellar formation in zebrafish embryos. (A,E) Schematic representation of the location of BRF1 variants examined in zebrafish within each of the two isoforms evaluated: isoform 1 (NP_001229717.1; 650 aa) and isoform 2 (NP_001229715.1; 584 aa). In purple are alleles that when tested are shown to be null, and in brown are alleles that score as hypomorphs based on zebrafish assays. (B,B′) Dorsal views of control zebrafish embryos and embryos injected with brf1b MO, brf1b MO + WT human BRF1, and brf1bMO + variant (R223W, S226L, or T259M) human BRF1 RNA in the context of isoform 1, respectively, at 3 d.p.f., stained with anti-α acetylated tubulin. (B) Head size measurements were taken using brightfield images (highlighted with a yellow outline in panel F). (B′) The area of the optic tecta was measured in the fluorescent images (highlighted with a cyan oval in panel F′). (C,D) Bar graphs showing the relative head size (C) and the optic tecta area (D). Data are presented as mean ± SE. Two-tailed t-tests were performed to assess statistical significance. The embryos coinjected with the MO and each of the variants were statistically different from MO alone but not statistically different when compared to embryos injected with MO + WT human BRF1, therefore scoring as benign. (F–I′) Functional assessment of the BRF1 missense variants in the context of isoform 2. Three d.p.f. embryos injected with brf1b MO, brf1b MO + WT human BRF1, brf1b MO + variant human BRF1 RNA (P292H, R223W, S226L, or T259M), or variant human BRF1 RNA alone in the context of isoform 2 were observed following staining with anti-α acetylated tubulin for head size (F) and for optic tecta area (F′), as well as for cerebellar defects (F′; illustrated with a red dashed box where maximum disorganization is observed). (G–I′) Bar graphs showing average head size, optic tecta area, as well as the percentage of embryos with cerebellar defects evaluated among each condition. To assess statistical significance among the evaluated conditions, two-tailed t-tests were performed for head size and optic tecta, and χ2 tests were performed for cerebellar disorganization to evaluate statistical significance across the conditions. In the context of isoform 2, functional analysis using zebrafish show that P292H and R223W are null, while S226L and T259M are hypomorphic alleles, showing an isoform-specific effect in which head size and optic tecta size are reduced and cerebellar disorganization occurs. No significant effects were observed for any of the phenotypes when the variants themselves were overexpressed. Each experiment was done at minimum in triplicate with at least 50 embryos per condition per replicate. (***) P-value ≤ 0.001 relative to MO + WT; (◊) P-value ≤ 0.001 relative to controls; (†) P-value ≤ 0.01 relative to MO.


