
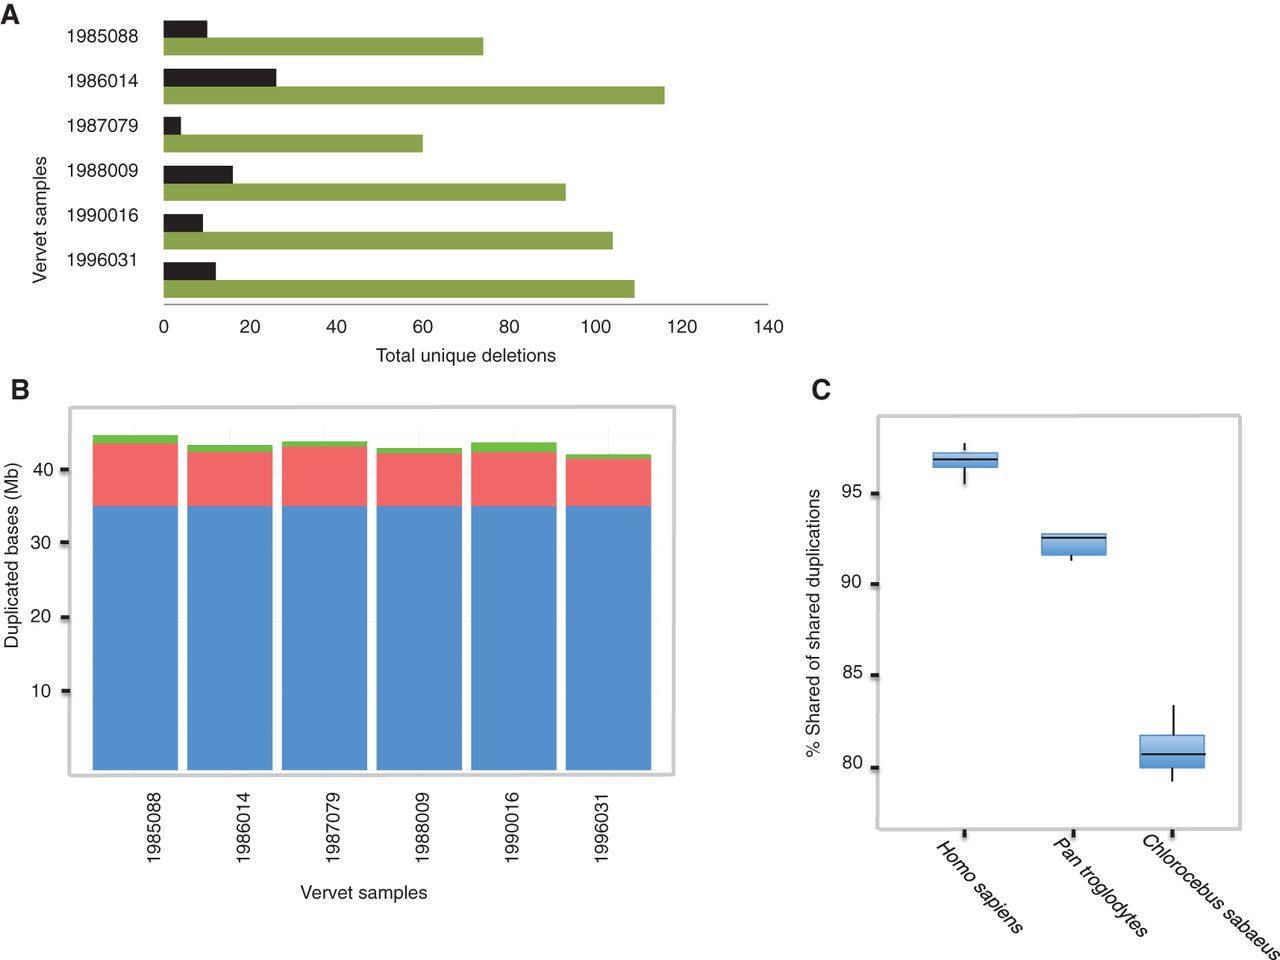
Structural variation among vervets. (A) The total deletions unique to each vervet for a size range of 500 bp–1 Mb are shown in green bars, and those genes where any exon space is deleted in one chromosome or greater are displayed as black bars. (B) Shared segmental duplications among vervets are blue bars, non-sample-specific duplications are red bars, and sample-specific duplications are green bars. (C) Shared duplications among vervets and other primate species; a minimum of six samples were previously sequenced per species population (Prado-Martinez et al. 2013). In all box plots, the vertical limits of the box represent one standard deviation around the mean, the horizontal line within the box is the median, and the whiskers extend from the box to the 25th and 75th percentiles.


