
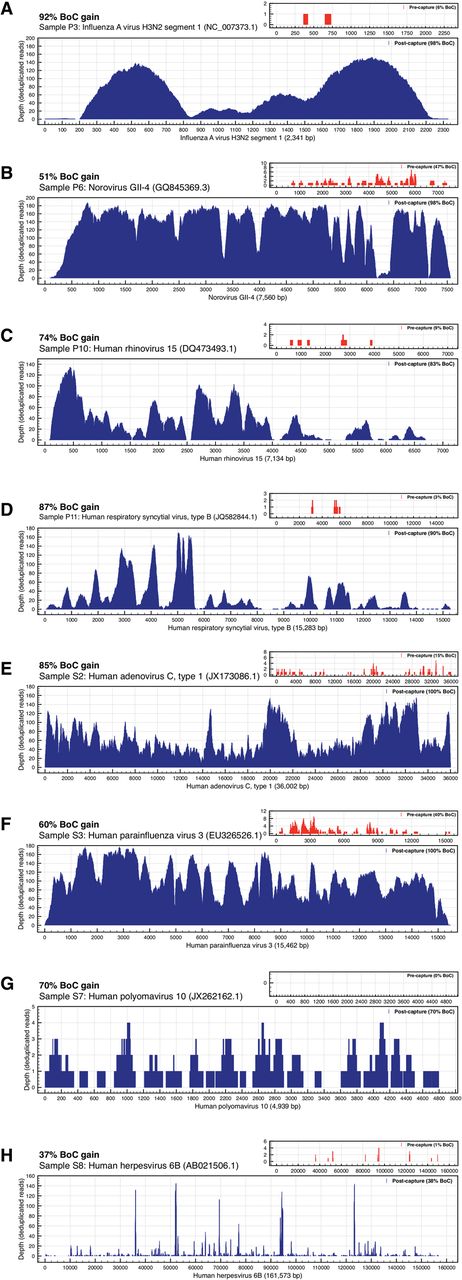
Targeted sequence capture enrichment. Examples are given showing the impact of targeted sequence capture on breadth and depth of genome coverage for eight representative viral genomes (A–H). For illustrative purposes, all of the coverage panels in this figure have been normalized by removing (deduplicating) reads based on identical alignment start-sites. Nucleotide positions along the reference genome are shown on the x-axis. The depth of deduplicated reads is shown on the y-axis. The shaded portion indicates the sequence coverage (breadth and depth) for each virus. Post-capture sequence coverage is represented in the larger panels in blue; precapture sequence coverage is shown in the insets in red. Note that y-axis ranges are different for each panel. At the top of each panel is shown the breadth of coverage (BoC) for the sample. The header of each panel includes breadth of coverage gain (BoC gain), sample id, and reference genome name and NCBI version number. BoC gain is calculated by subtracting the percentage of the length of the reference genome that was covered by sequence reads in precapture MSS from the percentage of the length of the reference genome covered by post-capture sequence reads.


