
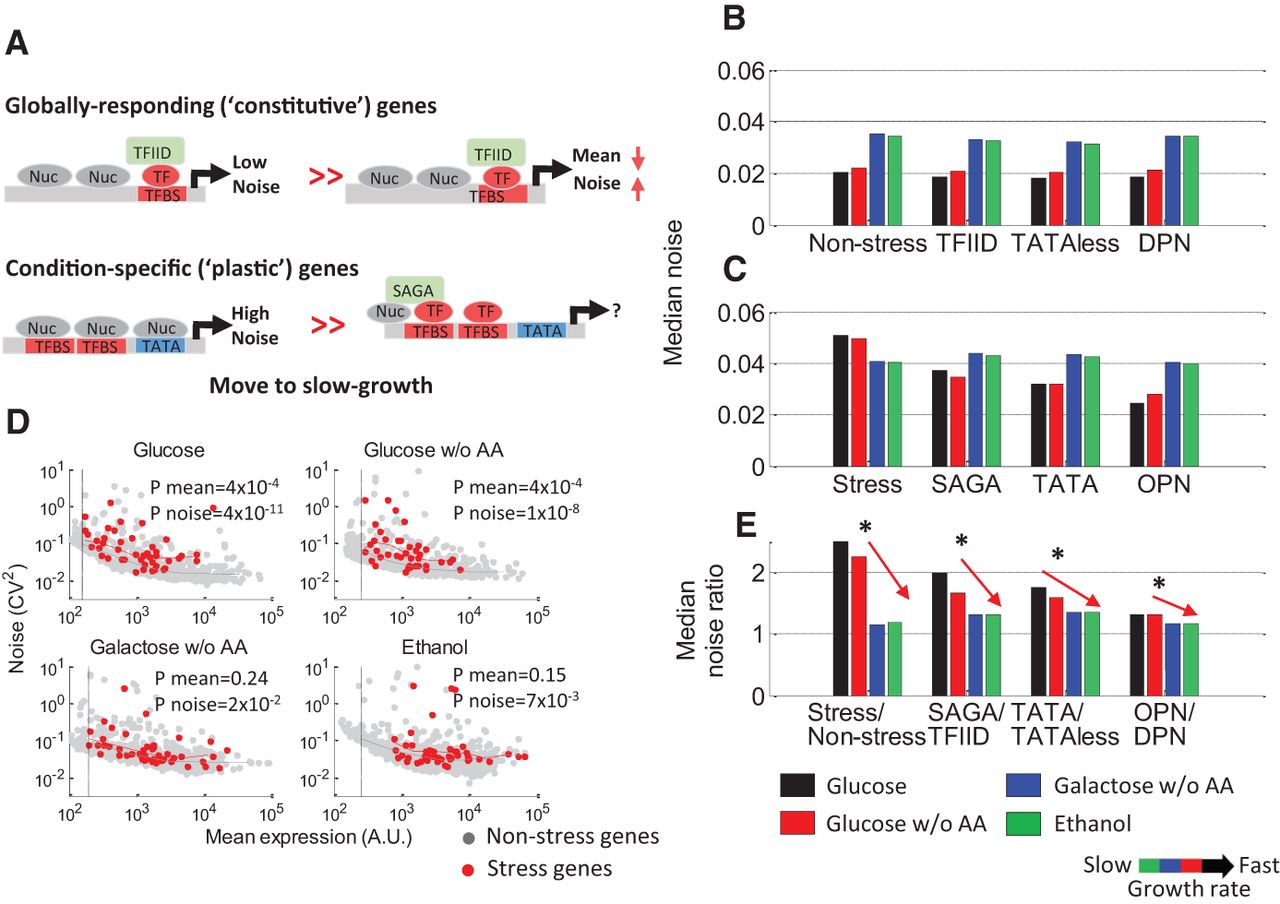
Features associated with high noise decrease in significance with decreasing growth rate. (A) A schematic depiction of two stereotypical promoter architectures in yeast, characteristic of either globally changing genes or condition-specific genes and associated with low or high levels of noise, respectively, in fast growth conditions (Field et al. 2008; Tirosh and Barkai 2008). (B–E) Promoters were classified according to activation in stress (Gasch et al. 2000), regulation by TFIID or SAGA (Huisinga and Pugh 2004), TATA or TATA-less (Basehoar et al. 2004), and high (OPN) or low (DPN) nucleosome occupancy (Tirosh and Barkai 2008). Conditions are colored as in Figure 1. (B) The median noise in each condition of the non-stress, TFIID-regulated, TATA-less, and DPN groups. Median noise of these groups increases in slow-growth conditions. (C) The median noise in each condition of the stress, SAGA-regulated, TATA, and OPN groups. In all growth conditions, these groups exhibit higher noise levels than their counterpart plotted in B. (D) Scatterplot of the YFP mean (x-axis) and CV2 (y-axis) for all promoters in each of the four conditions. Stress genes are colored red. In glucose (fast growth), global noise levels are low. Stress genes are repressed and associated with high levels of noise, higher than expected by their low mean. In ethanol (slow growth), global noise levels are high. Stress genes are up-regulated, and their noise levels decrease. (E) For each condition, the median noise of each group was divided by the median noise of its counterpart (e.g., median noise of promoters with TATA divided by the median noise of TATA-less promoters). Values higher than 1 indicate that the features are associated with high and low noise, respectively. For all features examined, values are above 1 but decrease with decreasing growth rate, indicating that their contribution to noise decreases in slow growth conditions. Significance was determined by K–S test and corrected using FDR (Supplemental Fig. S18).


