
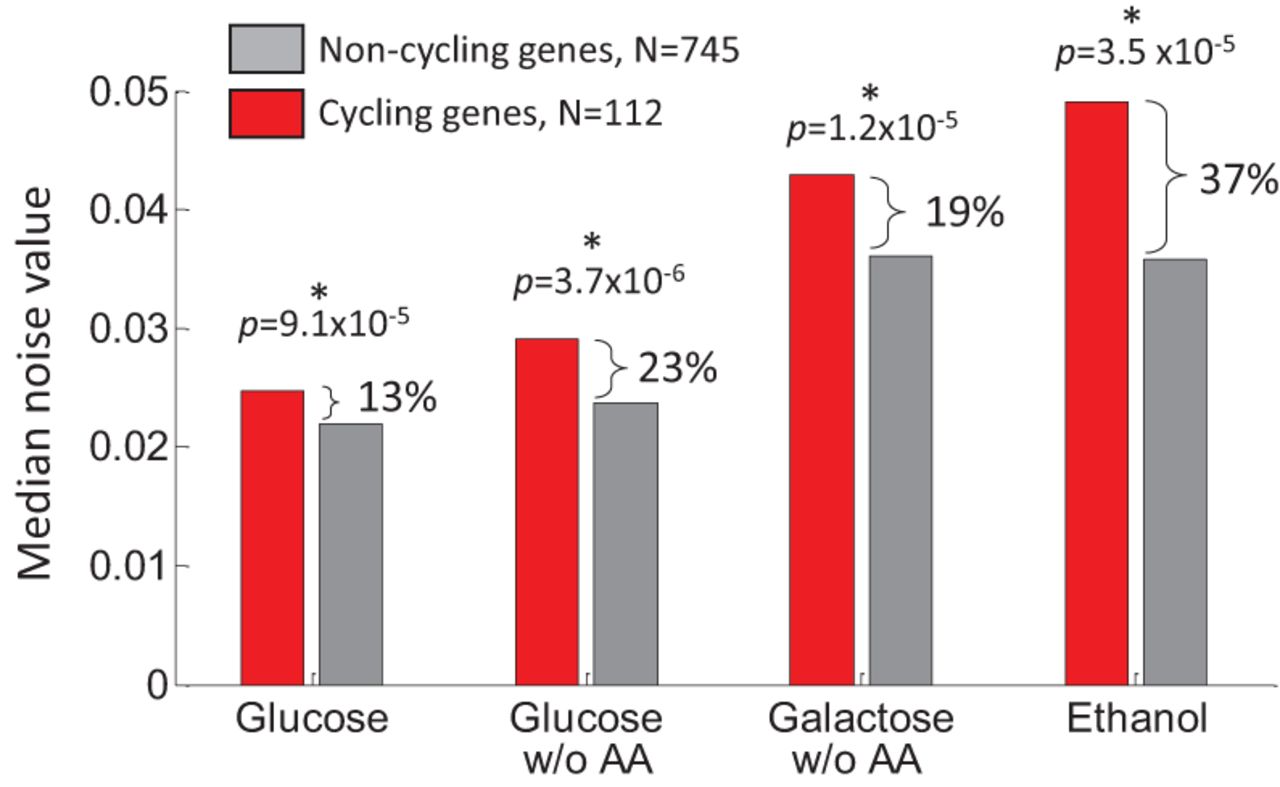
Figure 3.
Cell-cycle–regulated genes have higher variability levels. For each condition, the median noise level is shown for genes that cycle with the cell cycle (red bars) or not (gray bars), as previously defined by Spellman et al. (1998). In all conditions, cycling genes display higher variability levels than noncycling genes. P-values are for paired K–S tests (Supplemental Fig. S15).


