
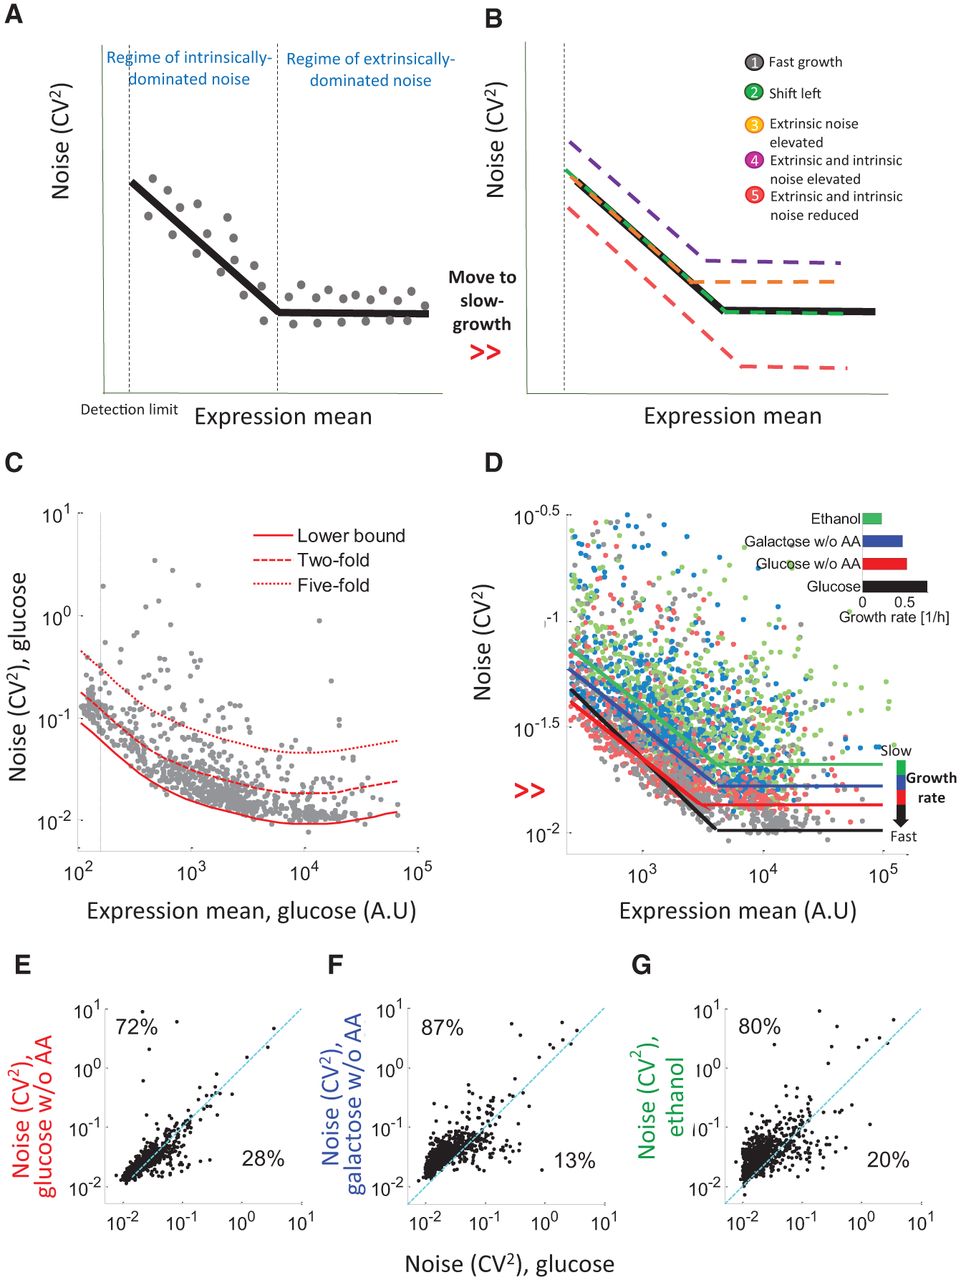
Gene expression noise is higher at lower growth rates. (A) A schematic of the genome-wide relationship between mean expression (x-axis) and noise (CV2, y-axis) in a single condition as determined experimentally (Newman et al. 2006; Taniguchi et al. 2010). At low expression levels, the noise is inversely correlated with the mean expression of the gene and is dominated by intrinsic factors. At high expression levels, noise and mean are uncorrelated, presumably since intrinsic noise levels decrease, and extrinsic factors set a lower bound (extrinsic limit) for the CV2 (Bar-Even et al. 2006; Newman et al. 2006; Taniguchi et al. 2010). The black line denotes the median of all genes. The dashed line separates the regimes dominated by intrinsic or extrinsic variability. (B) Alternative predictions for global, genome-wide changes in mean and noise when cells are moved to a condition that supports a lower growth rate. The black line is as in A, whereas colored lines denote the behavior in the new condition. (1) Mean-noise curve is unchanged in slow growth. (2) Slower growth is coupled with a global decrease in mean (Brauer et al. 2008; Keren et al. 2013). Promoters shift left along the black curve, such that the noise of each promoter is higher, but globally, the same mean expression is associated with similar noise levels in both conditions. (3) Slow growth causes an increase in extrinsic noise, such that the same mean expression is associated with higher noise levels. This effectively increases the extrinsic limit and shifts the boundary between the regimes. (4) Slow growth causes an increase in both extrinsic and intrinsic noise. (5) Slow growth causes a decrease in both intrinsic and extrinsic noise. Plausible reasons for the different predictions are discussed in Supplemental Note 1. (C) Scatterplot of the YFP mean (x-axis) and CV2 (y-axis) for cells grown in glucose plus amino acids. Red lines depict lower noise bound (solid), twofold (dashed), or fivefold (dotted) above the lower bound. (D) Scatterplot of the YFP mean (x-axis) and noise (CV2, y-axis) for all promoters in each of the four conditions with linear fits of the data: (black) glucose; (red) glucose w/o AA; (blue) galactose w/o AA; (green) ethanol. The different conditions exhibit different levels of noise for the same mean expression. (Inset) the growth rate (in doublings per hour) in each of the tested conditions. (E–G) Scatter of the noise of all promoters in the fastest growth condition (glucose, x-axis) and each of the other conditions (y-axis): glucose w/o AA (E); galactose w/o AA (F); and ethanol (G). Dashed cyan line indicates y = x. In all comparisons, most of the promoters are above the line (74%, 87%, and 81%, respectively), indicating that they display lower noise values in the fast growth condition.


