
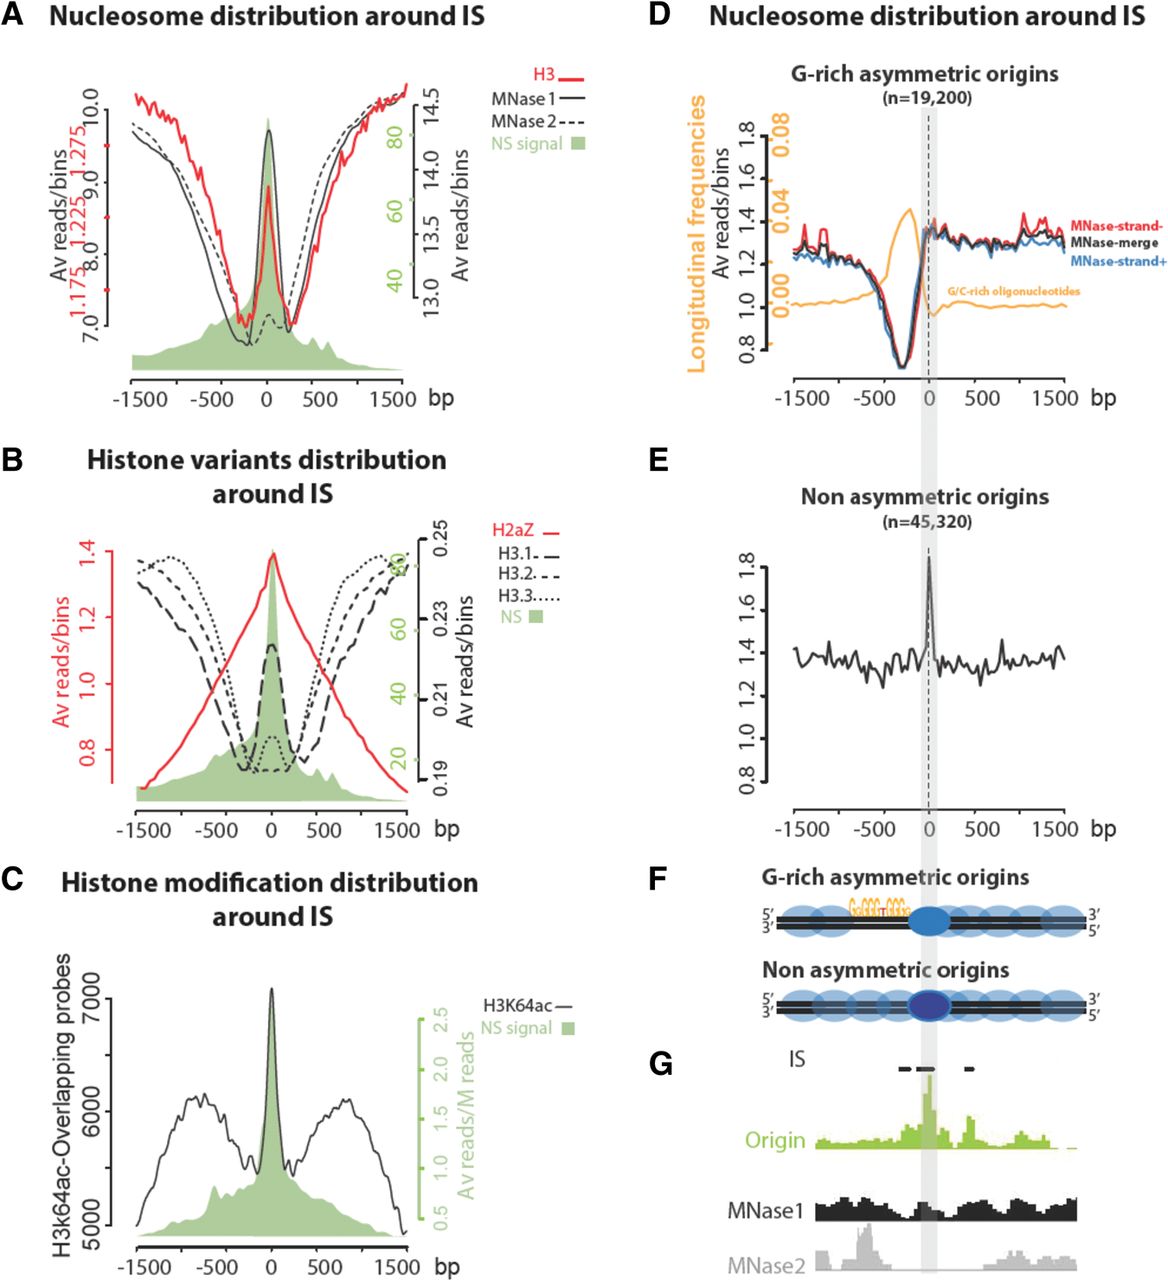
A labile nucleosome is present at the replication initiation site. (A) Nucleosome occupancy at origins. ChIP-seq signals for two different MNase digestion sets at ±1.5 kb around the IS (solid and dashed black lines). The global profile of origins centered on IS is in green. The two MNase profiles are matching, except on the IS, indicating a labile nucleosome. The histone H3 ChIP-seq signal is in red. (B) Distribution of histone H3 variants at origins. ChIP-seq signals for H3.1 (large dashed black line), H3.2 (medium dashed black line), H3.3 (fine dashed black line), and H2AZ (red line) at ±1.5 kb of IS (global profile in green). (C) Distribution of H3K64ac around IS. ChIP-chip signals for H3K64ac (50% top probes distribution) at ±1.5 kb of IS (global profile in green). (D,E) Nucleosome distribution around IS according to the G-rich sequence asymmetry. (D) A group of origins with G-rich asymmetry with initiation sites that show a highly significant enrichment (P-value 1 × 10⁻²) in either G-rich k-mers on the left side of the initiation sites (MNase-strand+, blue line, n = 9518) or in C-rich k-mers on the right side (MNase-strand−, red line, n = 9682). We thus oriented the right-side C-rich plot to systematically represent the features in the 5′ to 3′ direction. Note the striking consistency between MNase profiles obtained from left-side G-rich and right-side C-rich occurrences (MNase-merge, black line). The orange curve indicates the profile of G-rich occurrences around the IS considering the DNA strand on origins oriented according to the asymmetry of G-rich k-mer occurrences. (E) A group of nonasymmetric origins (n = 45,320) was defined by initiation sites with no significant enrichment for either of these two signals. Note the acute peak of MNase at the precise position of the IS and the absence of upstream depletion, which contrasts with G-rich asymmetric origins. (F) Schematic representation of the nucleosome distribution around IS. (G) Genome browser representations of Nascent Strands, MNase1, and MNase2 enrichment profiles are shown for a representative G-rich asymmetric origin.


