
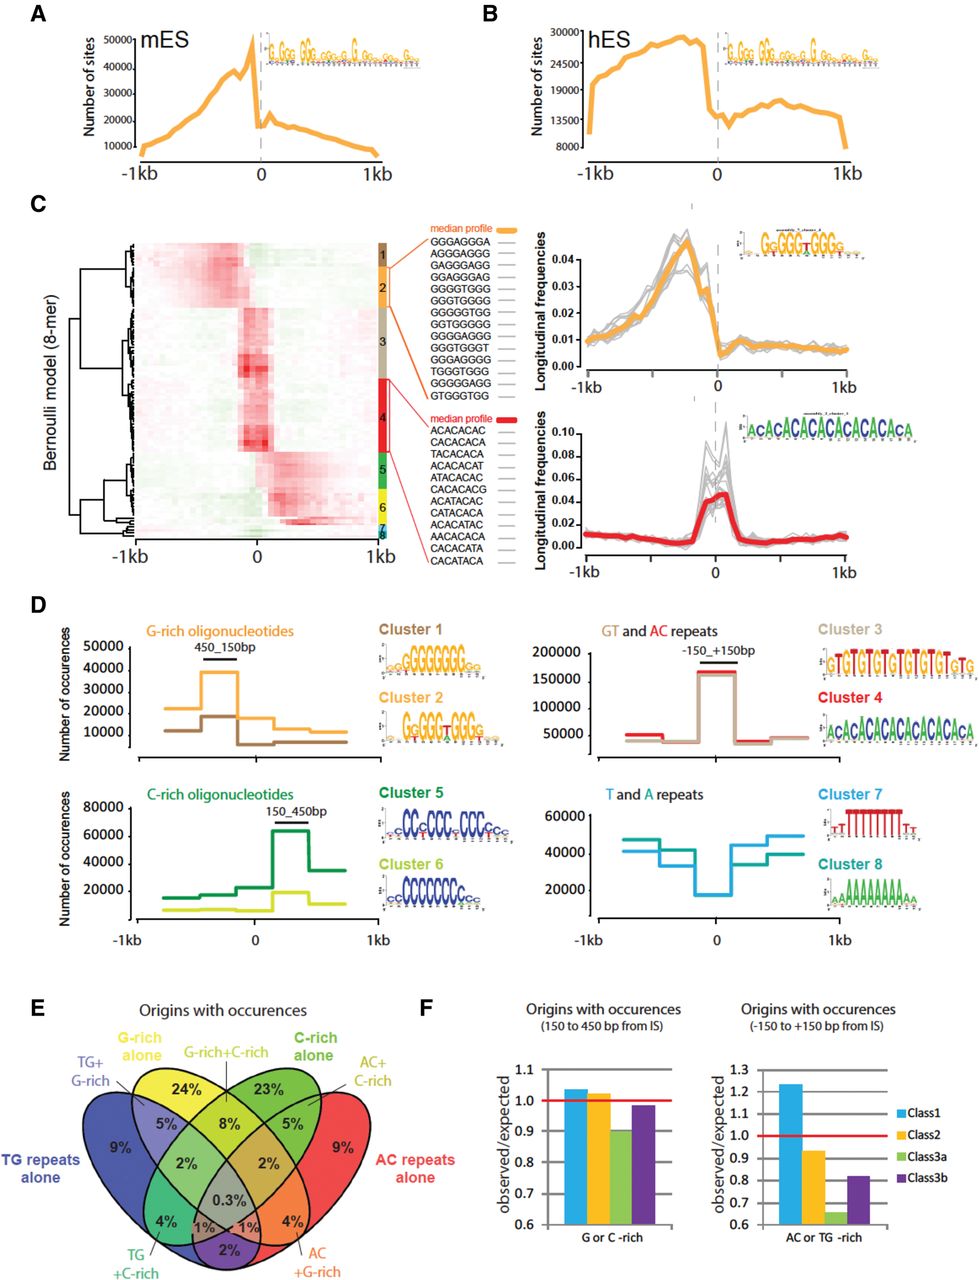
Sequence motifs at origins. (A,B) Distribution of OGRE sites around IS in mouse (A) and human (B) ES cells. PWM-based scanning of 1-kb regions on both sides of origin summits to detect OGRE motif instances. The x-axis indicates the position relative to the origin summit, the y-axis the number of predicted OGRE sites per 50-bp window, for the 65,019 mouse origins (A), and 149,791 human origins (B), respectively. (C) Clustering of oligonucleotide occurrence profiles. The left panel shows the hierarchical clustering of positional profiles of 8-mer occurrences in 50-bp non-overlapping windows over 1 kb on each side of peak summits. Each row corresponds to one specific k-mer. The color scale indicates the per k-mer normalized frequency. Local over- or underrepresentation is denoted by red or green hues, respectively. The right panels show detailed examples of individual position profiles for two clusters of k-mers. Colored bold lines represent the median profile of normalized frequencies for the entire cluster. The inset sequence logos were built by scanning sequences with matrices resulting from k-mer assemblies. (D) Profiles of origin-associated motifs. Distribution profiles of origin-associated motifs, obtained by scanning origin regions with the matrices identified in the previous step (C). The y-axis indicates the number of motif occurrences within each bin (300 bp). We combined all profiles in four different groups (G-rich, C-rich, GT/AC, and T/A). Sequence logos of the origin-associated motifs are displayed beside the corresponding profiles. (E) Proportion of origins with the representative motifs. Each origin containing at least one occurrence of the motif representative of each group is reported. The occurrence must be within the most enriched part within the origin (e.g., between +150 and +450 bp from the IS for cluster 2). (F) Proportion of origins positive for a specific motif per class. Origins containing at least one of the representative 8-mers are assigned according to their class. G/C-rich motif-positive origins are in Class 1, 2, and 3a/b (left), whereas origins enriched in AC or TG repeats are mainly in Class 1 (right).


