
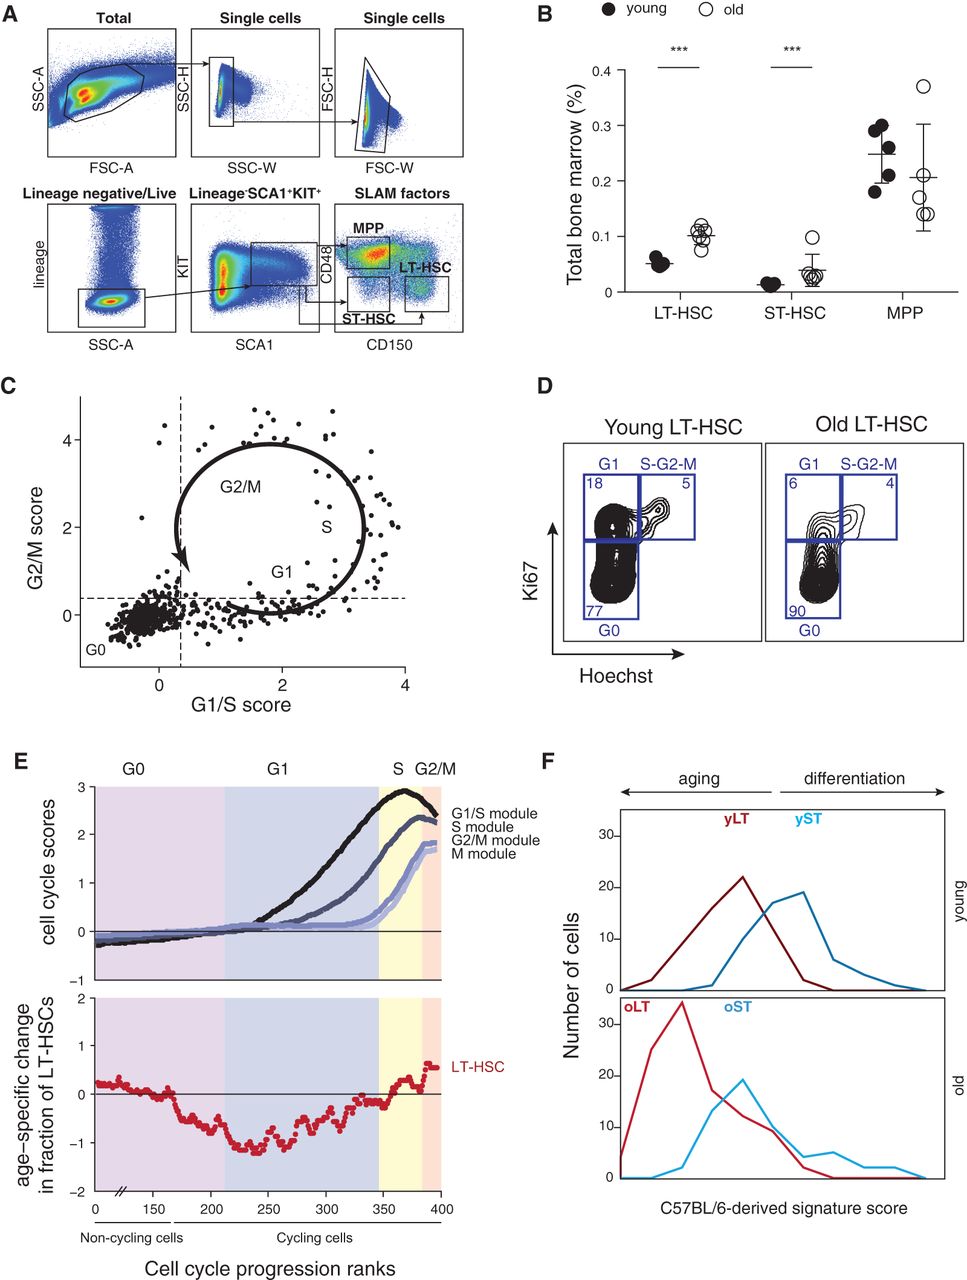
Age associated changes are conserved in DBA/2. (A) Gating strategy used to isolate LT-HSCs (LSK CD150+CD48−), ST-HSCs (LSC CD150−CD48−), and MPPs (LSK CD150−CD48+) from the BM of young (6–12 wk) DBA/2 mice. (B) LT-HSC compartment expands during aging. Shown are frequencies of LT-HSCs, ST-HSCs, and MPPs (x-axis) in young (black) and old (white) DBA/2 mice as a percentage of BM. Statistically significant differences: (***) P < 0.001. (C) Cell cycle trajectory inferred from single-cell RNA-seq. Shown is the average expression of G1/S genes (x-axis) and G2/M genes (y-axis). The arrow and labels reflect inferred cell cycle progression. (D) Representative FACS plots for Ki67/Hoechst intracellular staining in young and old LT-HSCs from DBA/2 mice. (E) Cell cycle distribution changes with age. (Top) Cells were ordered according to their inferred cell cycle progression, and the average expression of G1/S, S, and G2/M genes (y-axis, curves from dark to light gray) was calculated with a sliding window of 11 cells (x-axis). The first approximately 217 cells are “noncycling,” and only a small portion of them is depicted in the graph. The G0/G1 approximate border was defined as the first position with a positive G1/S score (i.e., above the average of all cells), and other borders were approximated by manual inspection of the figure. (Bottom) For each cell type, the log2 of the ratio between percentages of old cells divided by the percentage of young cells along the inferred cell cycle progression (with a sliding window of 100 cells) is shown. Shaded colors reflect the inferred cell cycle phases; cells are ordered by the analysis of the top panel. (F) Distribution of the C57BL/6-derived signature scores for young and old LT-HSCs and ST-HSCs, defined as the average normalized expression of young LT-HSC–enriched (dark red), old LT-HSC–enriched (light red), young ST-HSC–enriched (dark blue), and old ST-HSC–enriched (light blue) genes (x-axis), respectively.


