
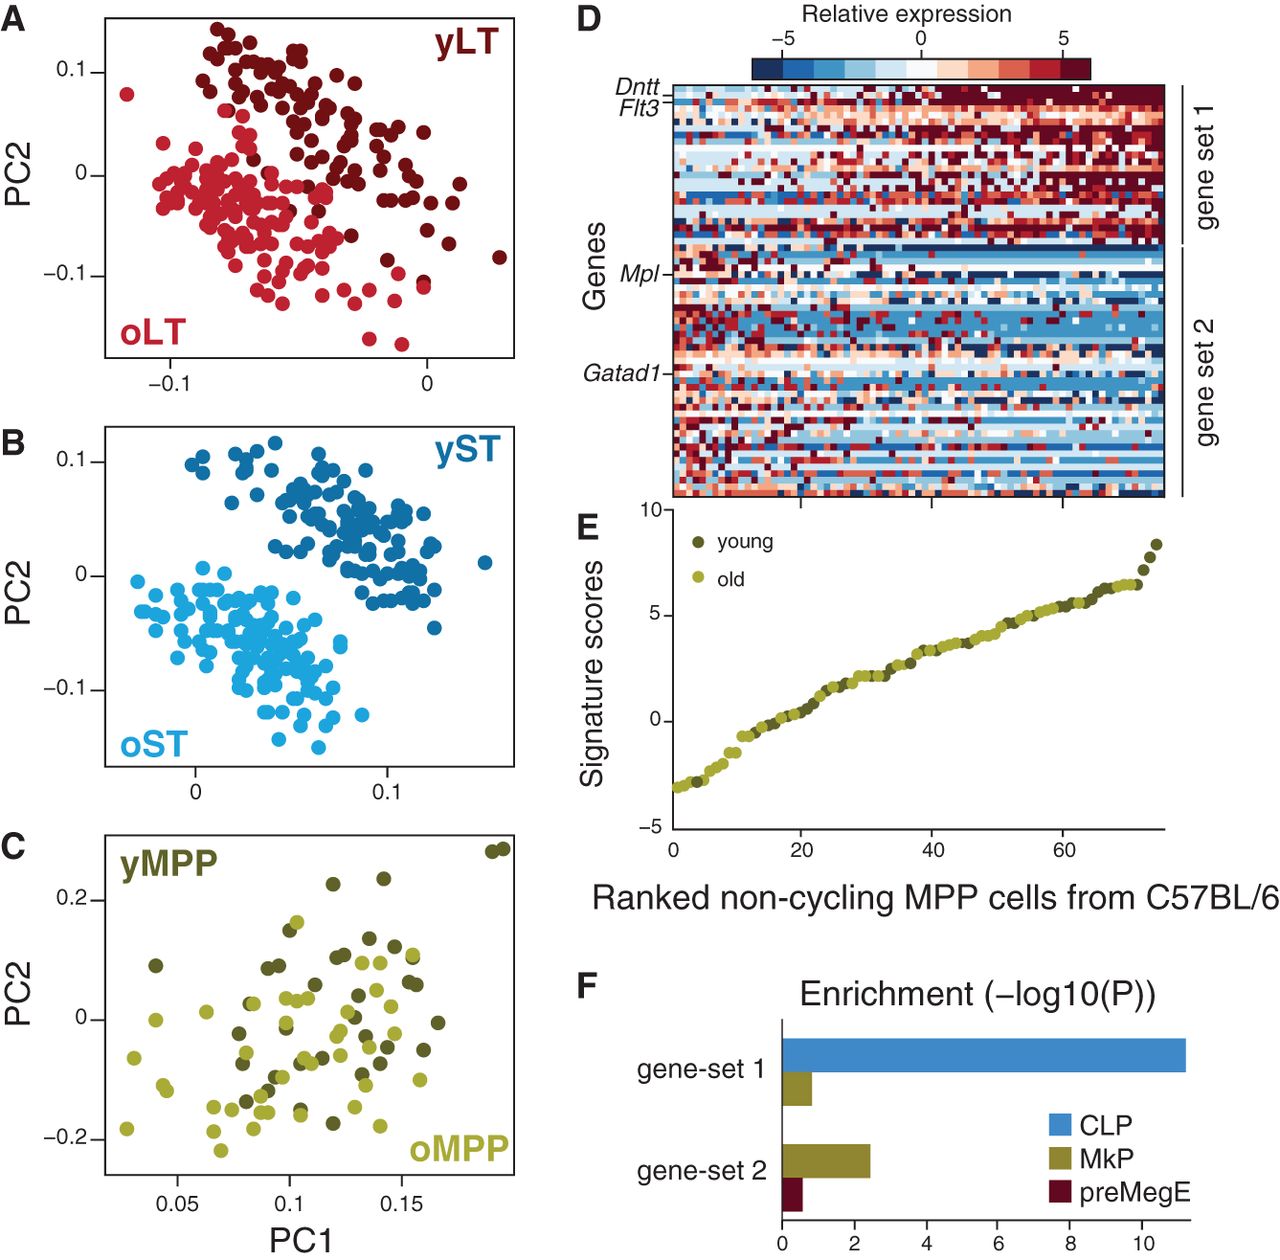
Subsets of cells with lymphoid- and myeloid-like transcriptional bias are discernible within immunophenotypically defined MPPs in C57BL/6 mice. (A–C) MPPs profiles are not distinguishable by age. PCA was performed independently for noncycling cells of each of LT-HSCs (A), ST-HSCs (B), and MPPs (C). Each plot shows the loadings of PC1 and PC2, colored based on cell type and age. Higher scores for young HSCs and lower scores for old cells are characteristic for LT-HSCs (A) and ST-HSCs (B), but not for MPPs (C). (D) Two distinct modules in MPPs. Heatmap shows the expression of genes from two distinct gene sets (rows; gene set 1 indicates lymphoid-biased; gene set 2, myeloid-biased) across all noncycling MPPs (columns). (E) Noncycling MPPs from both young and old mice form a continuous spectrum along the two states. Shown are the signature scores (average normalized expression of gene set 1 minus that of gene set 2) for each noncycling MPP from young (dark green) or old (light green) mouse. MPPs are ranked by increasing scores (x-axis). (F) Gene set enrichment analysis based on defined progenitor sets (CLP, MkP, and preMegE) within gene sets (gene set 1 and gene set 2) defining two subsets of MPPs in C57BL/6.


