
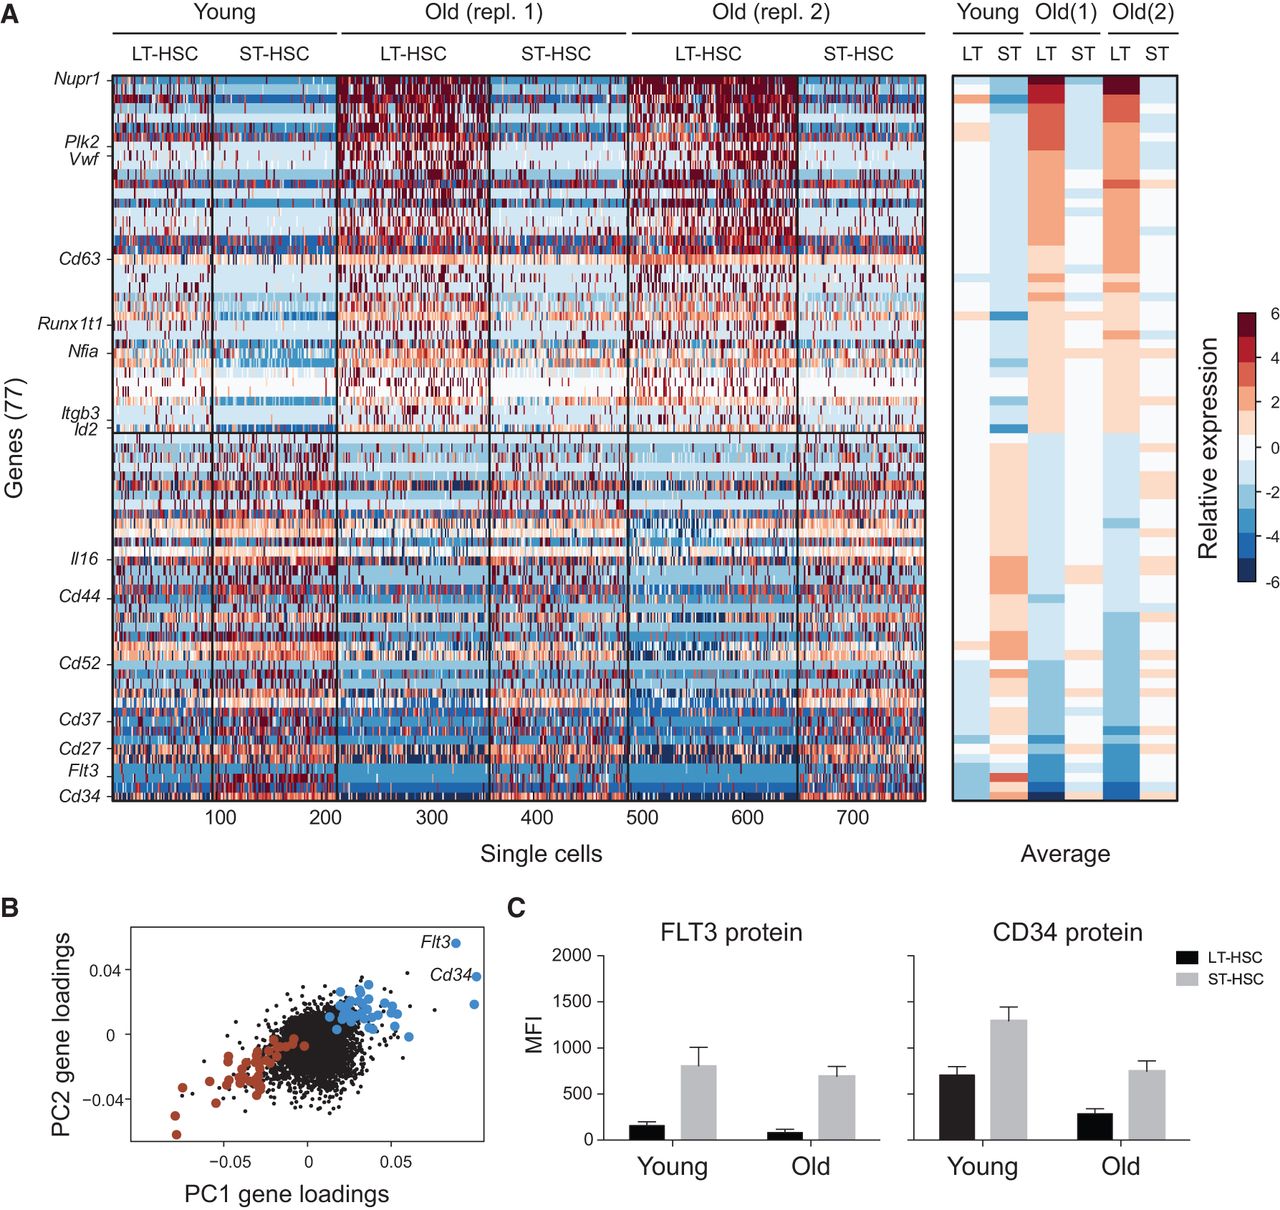
An inverse relationship between the transcriptional signatures of aging and differentiation. (A) A gene signature of aging and differentiation. (Left) Heatmap showing the relative expression levels of 77 genes (rows) significantly associated with aging and differentiation in all noncycling cells of LT-HSCs and ST-HSCs. Cells (columns) are sorted by age and within each age by cell type. Genes above the horizontal black bar are higher in LT-HSCs than in ST-HSCs and in old versus young cells. Genes below the horizontal black bar are higher in ST-HSCs than in LT-HSCs and in young versus old cells. (Right) The average expression of each gene (row) over all the noncycling cells from each combination of cell type and age (column). (B) Genes in the signature have correlated loadings on PC1 and PC2. Shown are the PC1 (x-axis) and PC2 (y-axis) loadings for each gene. Genes in the signature in B are marked in large points, colored in blue and red, respectively, for either high or low loadings for both PCs. (C) CD34 and FLT3 proteins are both decreased with age and increased with differentiation. Shown is the median fluorescence intensity (MFI; y-axis) of fluorescent-conjugated FLT3 (left) and CD34 (right) protein in young and old LT-HSCs (black) and ST-HSCs (gray).


