
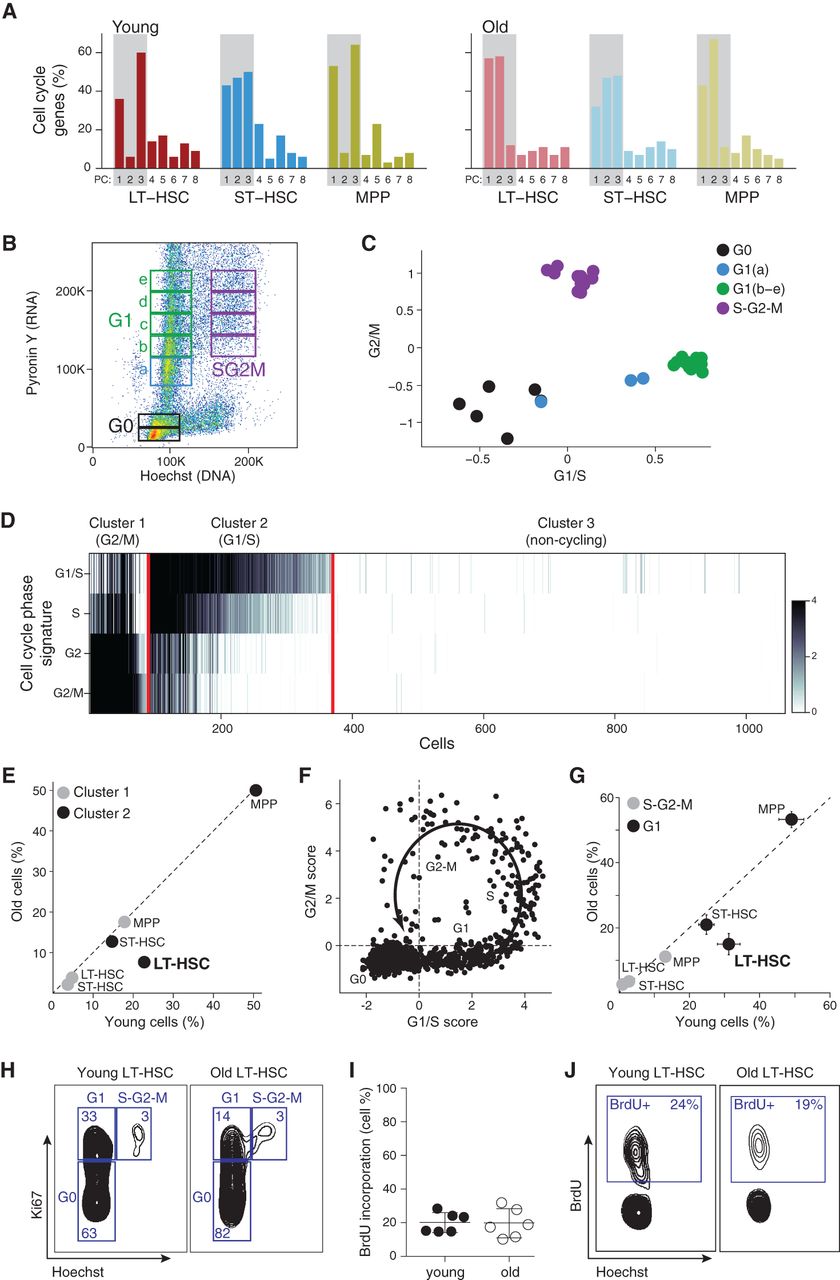
Old LT-HSCs have a lower frequency of cells in G1 phase of the cell cycle. (A) The top eight PCs in each cell type and age. Shown is the percentage of annotated cell cycle genes (y-axis) in the top 100 genes that correlate with each of the PCs (x-axis) in each population. (B) Cell cycle analysis on mouse KIT-enriched BM cells stained with pyronin Y (y-axis) and Hoechst (x-axis), reflecting for each cell the amount of RNA and DNA, respectively. Sorting gates and cell cycle phases are indicated. (C) RNA-seq of KIT-enriched BM cells at different cell cycle phases. Shown is the average expression of G1/S genes (x-axis) and G2/M genes (y-axis) from RNA sequenced from gates in B (color-coded). (D) HSC single-cell transcriptomes can be clustered by their cell cycle status. Heatmap shows average expression of cell cycle phases gene signatures (rows) in each cell (column). The cells are partitioned into three clusters expressing the G1/S program, G2/M program, or neither. (E) Cell cycle distribution changes as a function of cell type and age. The percentage of cells in cluster 1 (G2/M, gray) and cluster 2 (G1/S, black), within each cell type, for young (x-axis) and old (y-axis) HSCs. (F) Cell cycle trajectory inferred from single-cell RNA-seq. Shown is the average expression of G1/S genes (x-axis) and G2/M genes (y-axis). The arrow and labels reflect inferred cell cycle progression. (G,H) Lower frequency of G1 cells among old LT-HSCs based on FACS analysis. (G) Shown are cell frequencies in G1 (black) and S-G2-M (gray) in cells from young (x-axis) and old (y-axis) mice based on intracellular staining with Ki67/Hoechst. (H) Representative FACS plots for young and old LT-HSCs from C57BL/6 mice. (I) The frequency of young and old LT-HSCs in S phase based on in vivo bromodeoxyuridine (BrdU) incorporation. (J) Representative BrdU FACS plots for young and old LT-HSCs from C57BL/6 mice.


