
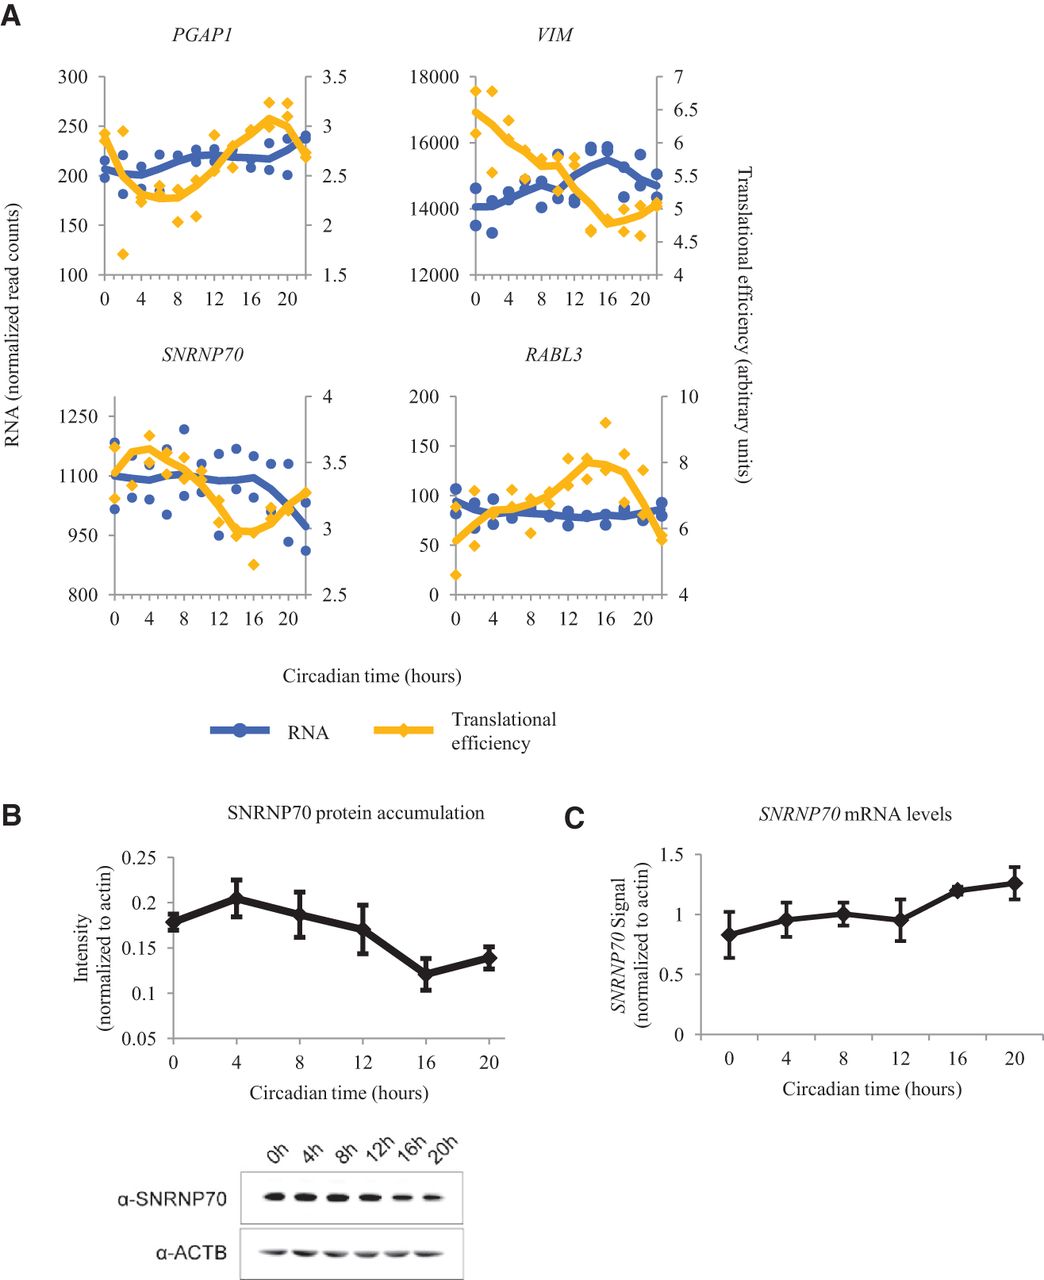
Analysis of genes that are translationally regulated by the circadian clock. (A) Traces for RNA and translational efficiency (TE) from PGAP1, VIM, SNRNP70, and RABL3 are plotted as a function of time. Blue traces for the RNA data use the axes on the left. Yellow traces for the TE data use the axes on the right. Points from both replicates are displayed, and the lines are plotted using a moving average (see Supplemental Methods for further detail). Traces from siARNTL libraries are displayed in Supplemental Figure S10. (B) The average SNRNP70 band intensity from eight protein immunoblots in wild-type synchronized U2OS cells is plotted as a function of time. A representative Western blot is shown at the bottom. (C) Average quantitative PCR measurements of SNRNP70 mRNA. All measurements were normalized to beta-actin. Error bars represent standard error of the mean.


