
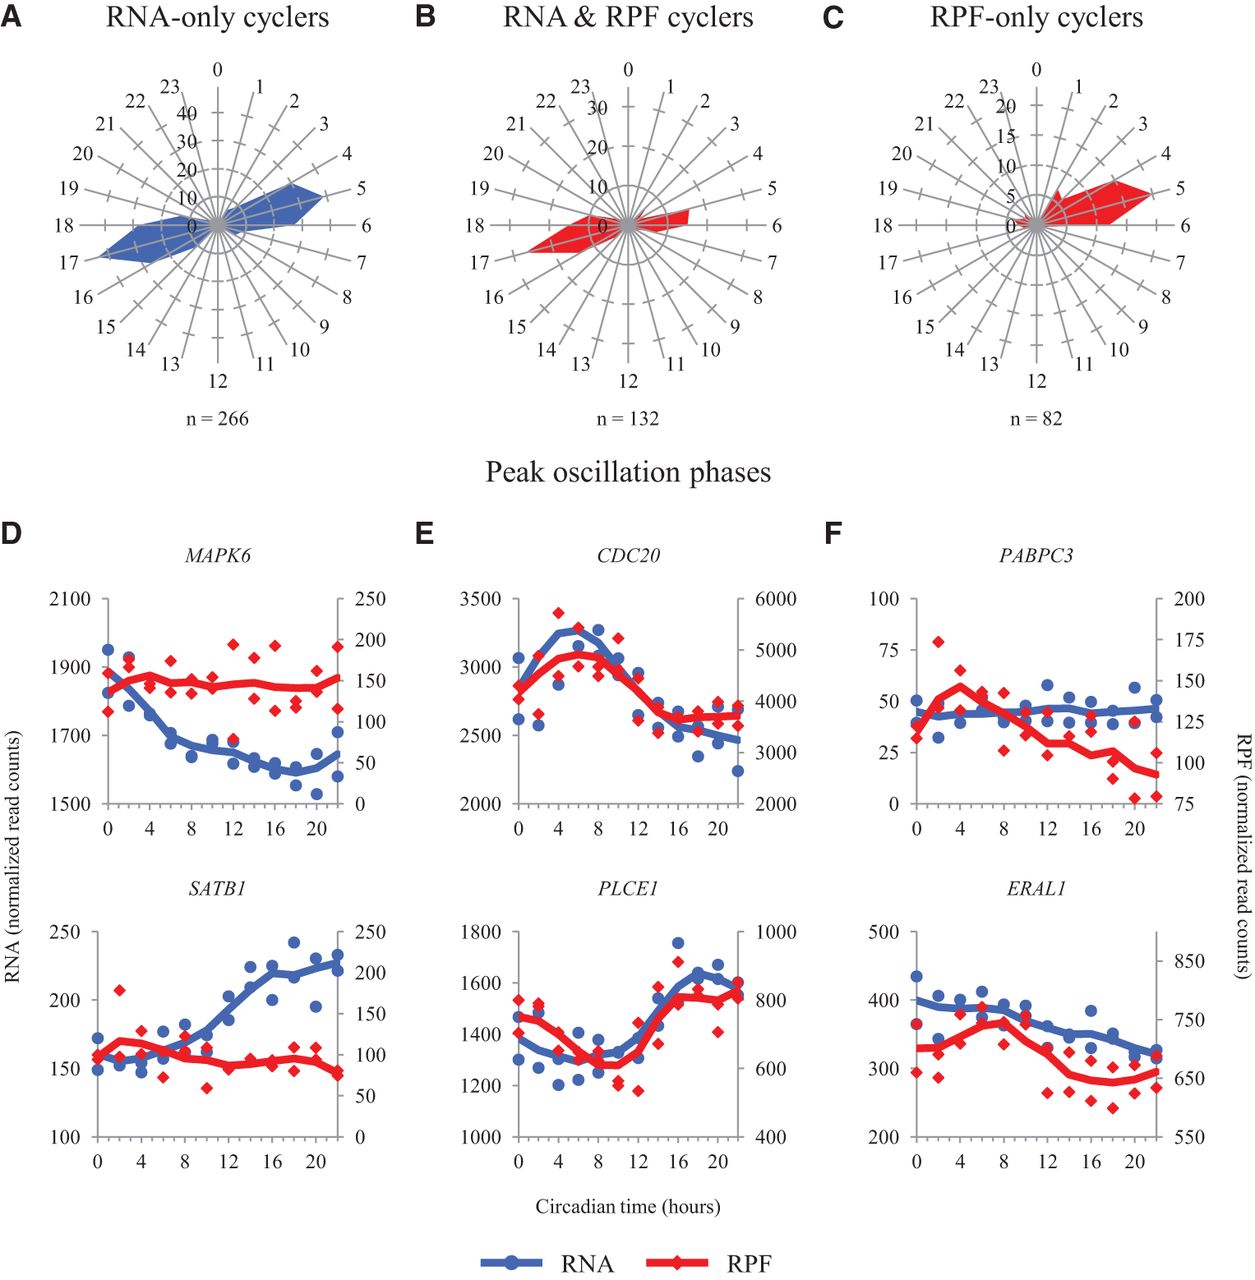
Peak RNA and RPF timing in cycling genes. (A–C) Radial diagrams displaying circadian phase information for those genes that (A) oscillate in the RNA data only (RNA FDR < 0.05; RPF P > 0.2), (B) oscillate in the RNA and RPF data (RNA FDR < 0.05; RPF FDR < 0.2), and (C) oscillate in the RPF data only (RPF FDR < 0.2; RNA P > 0.2). Note that B depicts phase data for both RNA and RPF, as both show peaks at the same time of day; A and C depict phases for RNA and RPF, respectively. The number of genes in each set is displayed below the corresponding radial diagrams. The blue and red radial diagrams display phase information for RNA and RPF data, respectively. All phases were calculated using JTK_CYCLE. (D–F) RNA and RPF traces for two representative genes in each of the above groups are plotted as a function of circadian time. (D) MAPK6 and SATB1 oscillate in the RNA data only. (E) CDC20 and PLCE1 oscillate in both the RNA and RPF data. (F) PABPC3 and ERAL1 oscillate in the RPF data only. Blue traces for the RNA data use the axes on the left. Red traces for the RPF data use the axes on the right. Points from both replicates are displayed, and the lines are plotted using a moving average (see Supplemental Methods for further detail). Traces from siARNTL libraries are displayed in Supplemental Figure S8.


