
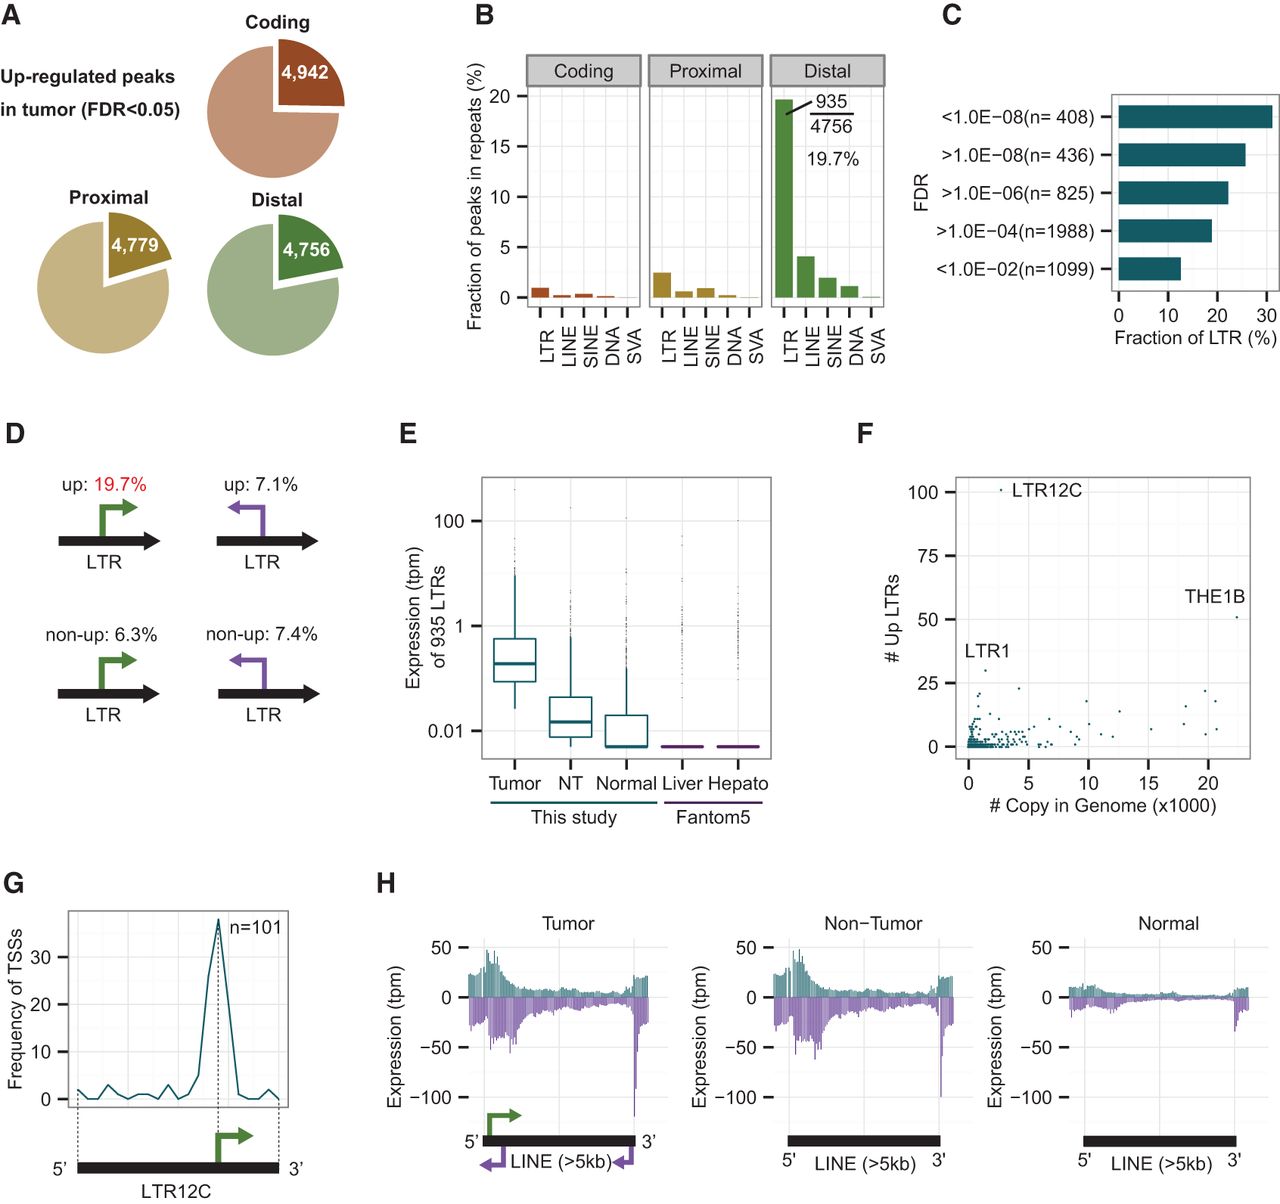
LTR retroviral promoters are up-regulated in human HCC tumors. (A) Fractions of significantly up-regulated coding, proximal, and distal peaks in HCC tumors. The threshold is set to P < 0.05 (FDR, calculated with edgeR). (B) Fractions of peaks overlapping with repetitive elements in the sense direction. Nearly 20% (935/4756) of the up-regulated distal peaks overlap with LTR elements. (C) Fractions of peaks overlapping with LTRs at different levels of significance. The most significant bin (FDR < 1.0 × 10⁻⁸) shows the highest fraction (30%) of LTRs. (D) A summary of peaks in LTR elements (sense versus antisense and up versus non-up). Fractions of peaks in other repeats do not show such differences (Fig. 2B; Supplemental S2B–D). For example, SINE elements are 2.0% for up and 2.6%–4.2% for other cases, while SVA elements are 0.1% for up and 0.0%–0.1% for other cases. (E) Expression levels of 935 LTRs in tumor, nontumor (NT), and normal liver tissues. “Liver” (normal adult and fetus liver tissues) and “Hepato” (three biological replicates of primary hepatocytes) data from the FANTOM5 Project are shown for comparison. To avoid log-of-zero errors, 0.005 was added to the tpm values for this box plot. The median values of “Normal,” “Liver,” and “Hepato” are 0.005, indicating 0 tpm. (F) Activated LTR subfamilies versus copy numbers in the human genome. (G) Relative position of CAGE peaks on LTR12C. The majority of CAGE peaks are located at a relative position of 70% from the 5′ end. Black bar and green arrow: presumed promoter architecture conserved among LTR12C elements. (H) Distribution of CAGE tags on long (>5 kb) LINE elements. Blue (purple) bars: sense (antisense) direction with respect to the LINE elements. Arrows: potential promoters embedded in full-length L1 elements.


