
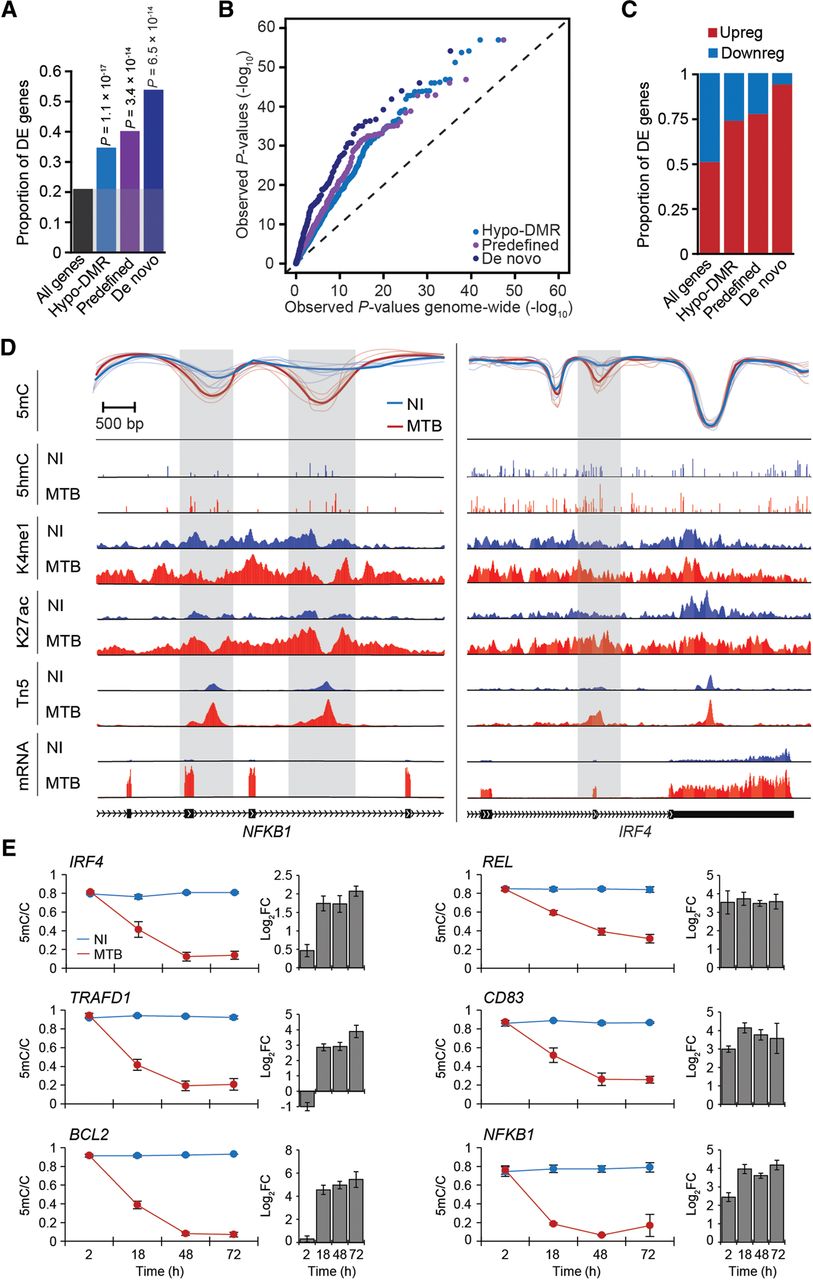
Differential methylation is coupled to differential gene expression. (A) Proportion of differentially expressed (DE) genes (y-axis) observed among all tested genes and among genes associated with different subgroups of hypo-DMRs. (B) QQ-plot showing that genes in the vicinity of hypo-DMRs show stronger statistical evidence for being differentially expressed in response to MTB infection (P-values on y-axis) compared to all genes tested (P-values on x-axis). (C) Proportion of up- and down-regulated genes among DE genes associated with the different subgroups of hypo-DMRs. (D) Examples of genes encoding for two key transcription factors, NFKB1 (left panel) and IRF4 (right panel) that are strongly up-regulated in response to MTB infection and for which we identified one or more hypomethylated regions (gray shading) that overlap with putative enhancer elements. Normalized read signals for the indicated features are shown for noninfected (blue tracks) and infected conditions (red tracks). (K4me1) H3K4me1, (K27ac) H3K27ac, (Tn5) transposase-accessible chromatin, (mRNA) mRNA expression levels. (E) Changes in DNA methylation levels (y-axis) measured by pyrosequencing across four time points after MTB infection (2, 18, 48, and 72 h) along with the corresponding fold changes in log2 scale (log2FC) in normalized gene expression of the associated gene. Blue and red lines represent average methylation levels in noninfected and MTB-infected DCs, respectively. All data are represented as mean ± SEM, with a minimum of three biological replicates per group. PyroMark and real-time PCR data are reported in Supplemental Tables S7 and S8, respectively.


