
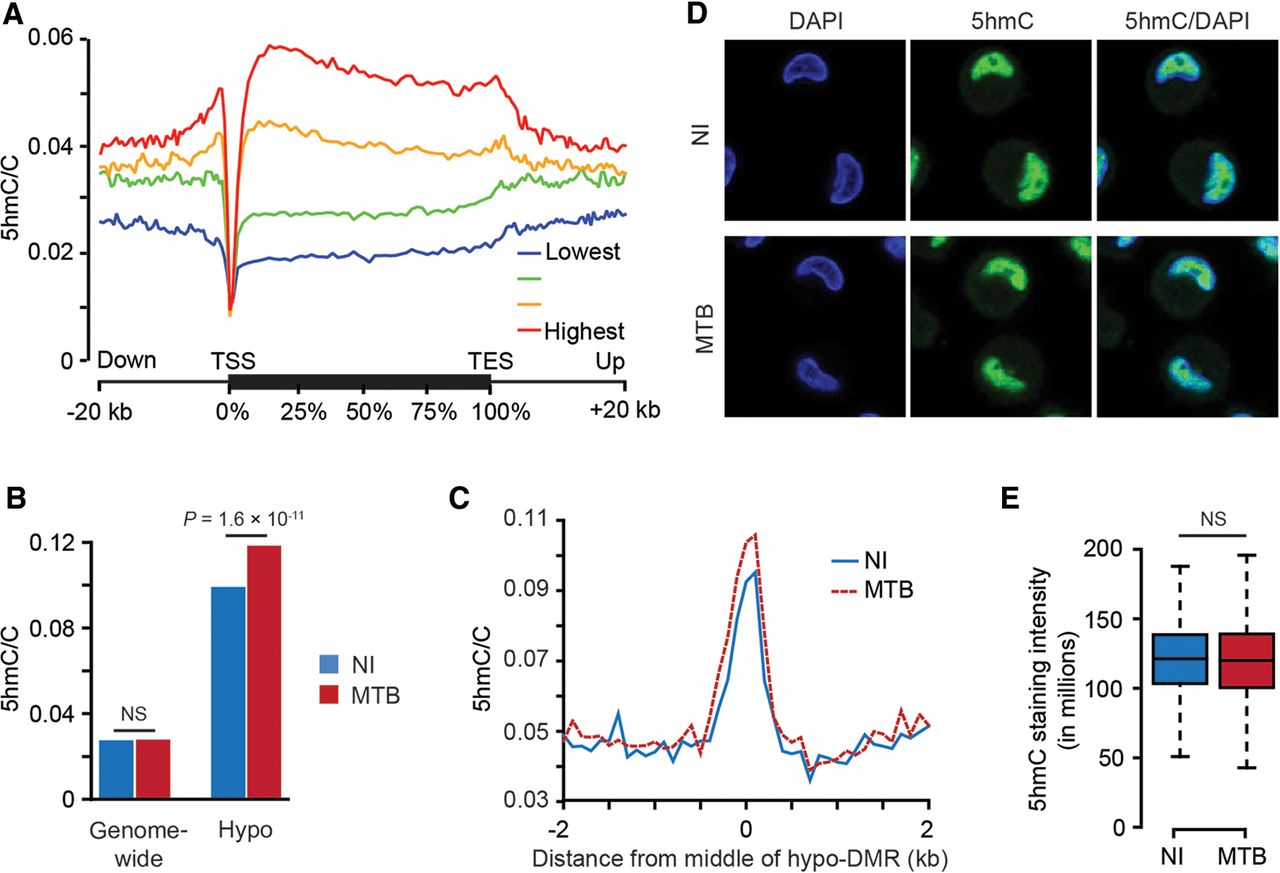
5hmC is enriched in MTB-DMRs prior to infection. (A) Metagene profiles of 5hmC levels relative to Ensembl transcripts expressed at different levels in human DCs. We grouped genes in four quantiles based on their expression levels in noninfected DCs. (B) Barplots showing mean 5hmC/C ratios within hypomethylated regions, before (blue) and after infection (red). (C) Composite plots of patterns of 5hmC before (blue) and after (red) MTB infection ±3 kb around the midpoint of hypomethylated regions. (D) 5hmC staining in noninfected (top panel) and MTB-infected DCs (bottom panel). 5hmC levels are given by the levels of Alexa 488 (green: middle panel). Cells counterstained with DAPI to localize the nucleus are shown in the first panel. (E) Box plots showing the distribution of 5hmC staining intensity. No significant differences were observed between the two groups.


