
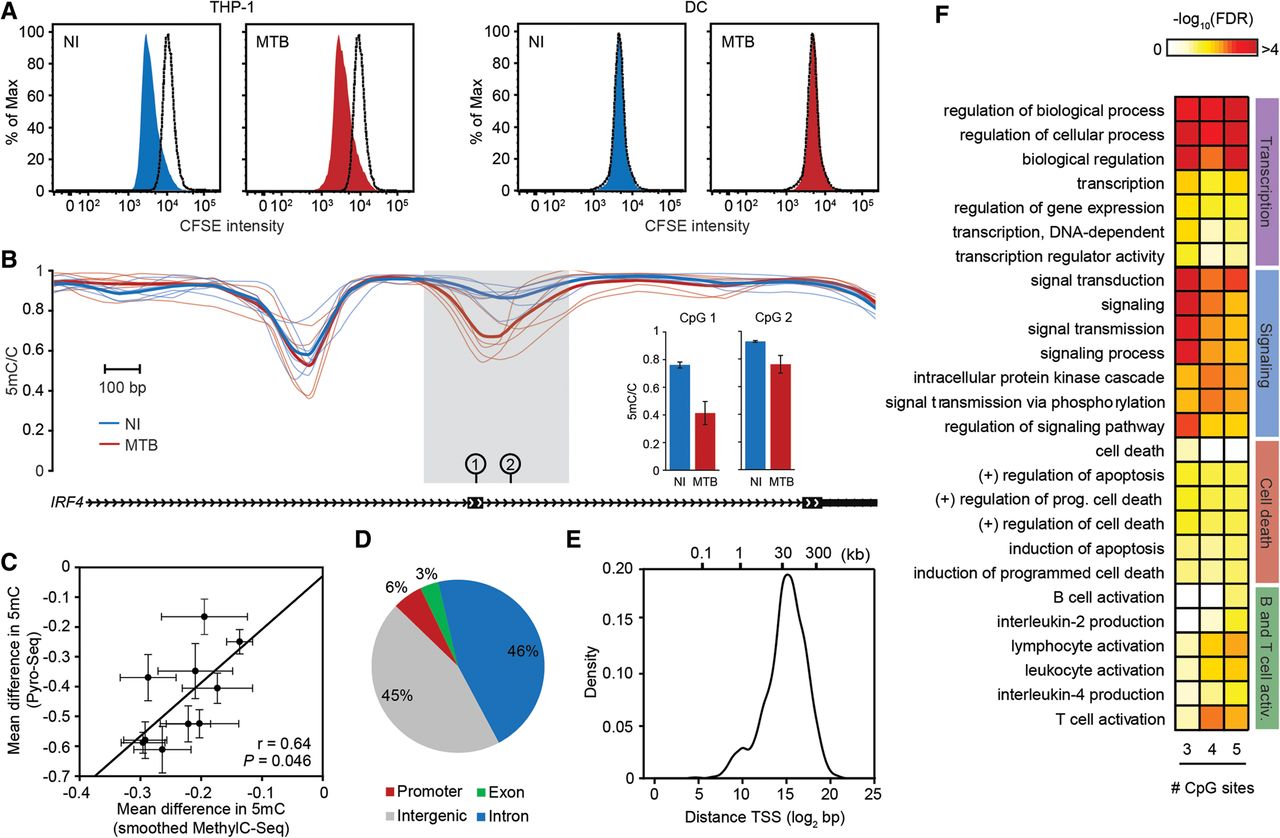
MTB-induced changes in methylation in post-mitotic human DCs. (A) CFSE-labeled THP-1 (left) and CFSE-labeled DCs (right). Proliferation was assayed in either noninfected cells (NI) or cells infected for 18 h with MTB. Similar results were observed 48 h post-infection (Supplemental Fig. S16). (B) Example of a region showing active loss of DNA methylation in response to MTB infection (gray shading). The plot shows smoothed methylation values (y-axis) for six noninfected (blue) and six MTB-infected samples (red). Thick blue and red lines show average methylation levels for noninfected and infected cells, respectively. The inset on the right shows methylation levels at two individual CpG sites within the hypomethylated region using bisulfite pyrosequencing as a validation method. (C) Scatterplot showing the correlation between MethylC-seq (x-axis; smoothed data) and pyrosequencing data (y-axis) for mean differences in methylation between infected and noninfected cells, at 10 CpG sites within hypomethylated DMRs. Data are represented as mean ± SEM, n = 6 for MethylC-seq and n = 5 for Pyro-seq. (D) Pie chart showing the distribution of hypomethylated regions in different genomic regions. Each MTB-DMR is counted only once: The overlap of a genomic region excludes all previously overlapped MTB-DMRs, starting clockwise from promoters (TSS ± 500 bp; red). (E) Distribution of distances of MTB-DMRs to the nearest TSS. (F) Representative gene ontology (GO) terms enriched among genes associated with hypomethylated regions. To demonstrate that the enriched biological processes are largely robust to the cutoff used to define MTB-DMRs, we show how these results differ depending on the number of differentially methylated CpG sites (P < 0.01) required to call an MTB-DMR (from at least three to at least five consecutive sites).


