
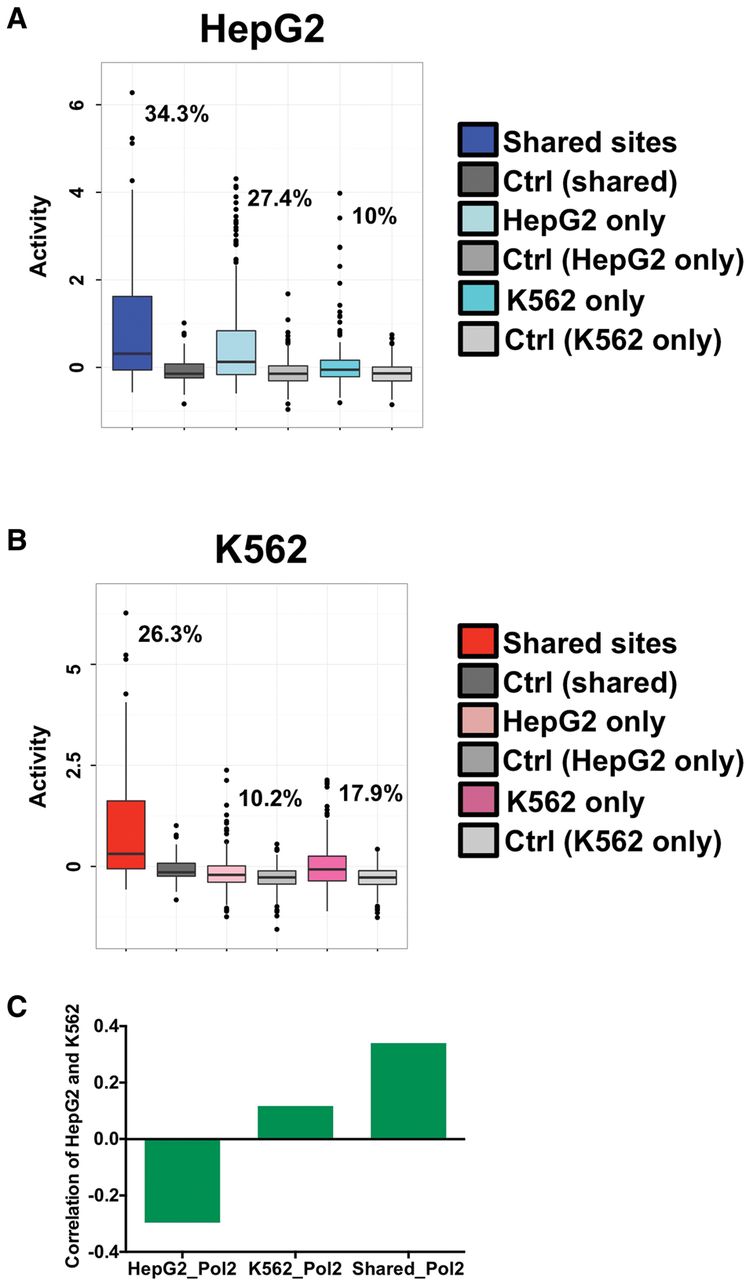
Cell-type specificity analysis of RNAP2-associated sites. (A) HepG2 CRE-seq activity for distinct classes of RNAP2-associated elements is shown as box plots. The log2-transformed CRE-seq activity (RNA/DNA barcode counts) is displayed on the y-axis. HepG2 CRE-seq activities are given for binding sites that are shared between HepG2 and K562 cells (Shared sites), as well as cell-type–specific sites that are found in only HepG2 cells (HepG2 only) or only in K562 cells (K562 only). Associated HepG2 CRE-seq activities of scrambled control sequences for each of the three classes of sites are also plotted. A key is given on the right of the graph. The percentage of elements from each of the three classes of sites above the 95th percentile of associated scrambled control sites are displayed on the plot. (B) K562 CRE-seq activity for distinct classes of RNAP2-associated elements is shown as box plots. The log2-transformed CRE-seq activity (RNA/DNA barcode counts) is displayed on the y-axis. K562 CRE-seq activities are given for binding sites that are shared between HepG2 and K562 cells (Shared sites), as well as cell-type–specific sites that are found in only HepG2 cells (HepG2 only) or only in K562 cells (K562 only). Associated K562 CRE-seq activities of scrambled control sequences for each of the three classes of sites are also plotted. A key is given on the right of the graph. The percentage of elements from each of the three classes of sites above the 95th percentile of associated scrambled control sites are displayed on the plot. (C) Spearman rank correlations between HepG2 and K562 CRE-seq activities for RNAP2-associated shared sites (Shared_Pol2), HepG2-specific sites (HepG2_Pol2), and K562-specific sites (K562_Pol2) are given. Shared sites exhibit positive correlation between CRE-seq activities in HepG2 and K562 cells, whereas cell-type–specific sites are not as strongly correlated (K562-specific sites) or negatively correlated (HepG2-specific sites).


