
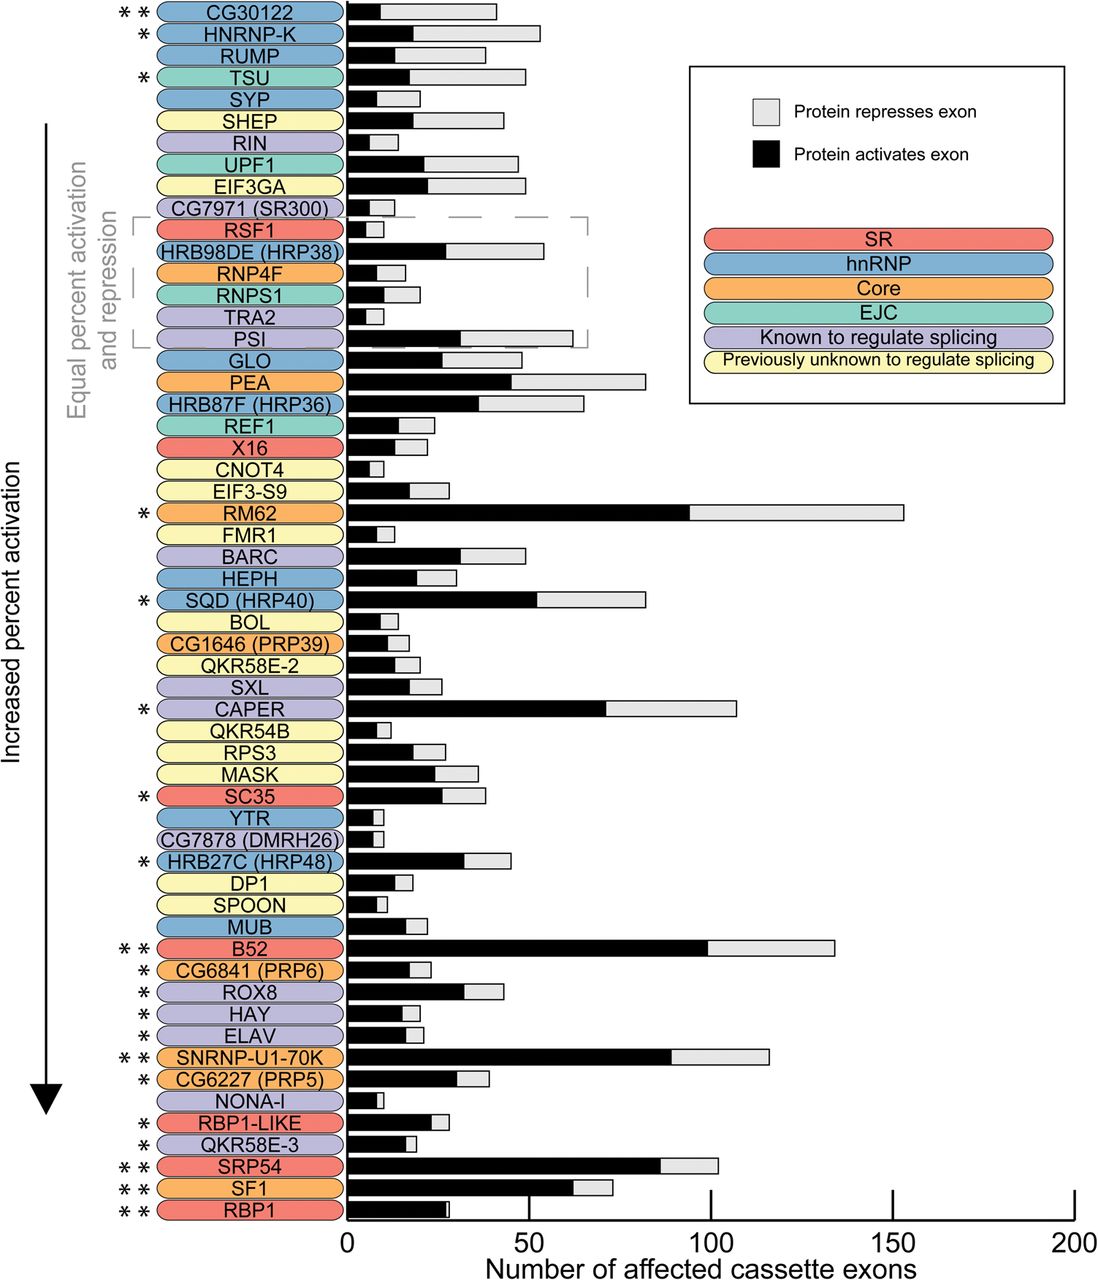
Figure 3.
Bias of activation and repression of cassette exons. The number of cassette exons that are activated and repressed by each protein is shown. The proteins are ordered by increasing proportion of activated exons. The significance of the bias to activate or repress exons is indicated with asterisks: two-sided binomial test; (*) P < 0.05, (**) Bonferonni-corrected P < 0.05.


