
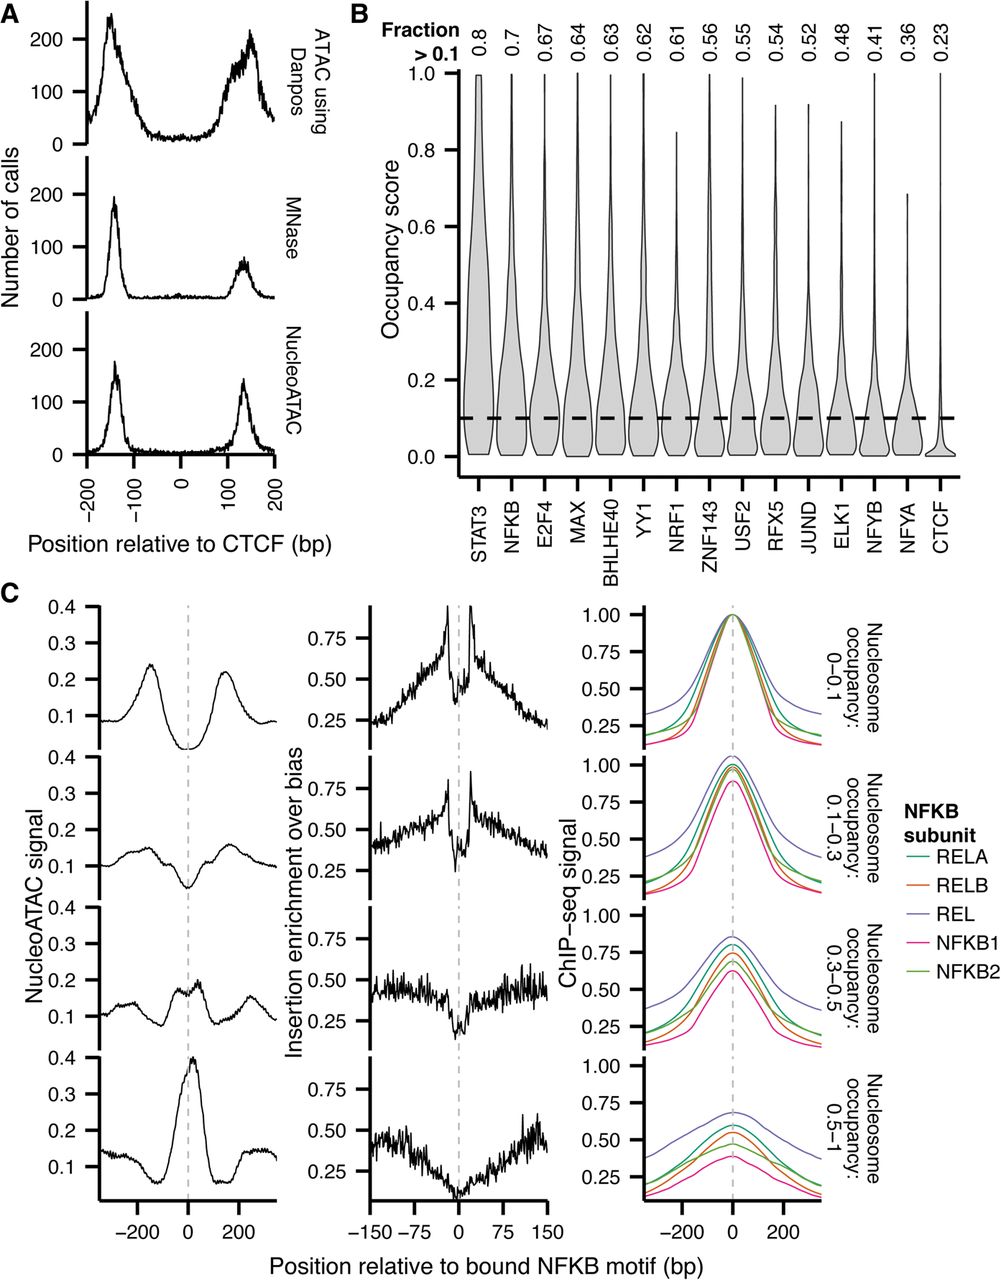
Figure 7.
NucleoATAC defines stereotyped TF-nucleosome relationships. (A) Nucleosome dyad density relative to CTCF binding site for nucleosomes called previously with DANPOS (top), MNase (middle), or NucleoATAC (bottom). (B) Nucleosome occupancy distributions for sequence-specific TFs. (C) NucleoATAC nucleosome signal (left), ATAC-seq insertion profile (middle), and NFKB subunit ChIP-seq signal for NFKB at sites with different nucleosome occupancies (right). Insertion frequency normalized by sequence bias model. ChIP-seq intensities for each subunit were normalized such that the maximum intensity for the sites with 0 to 0.1 nucleosome occupancy was 1.


