
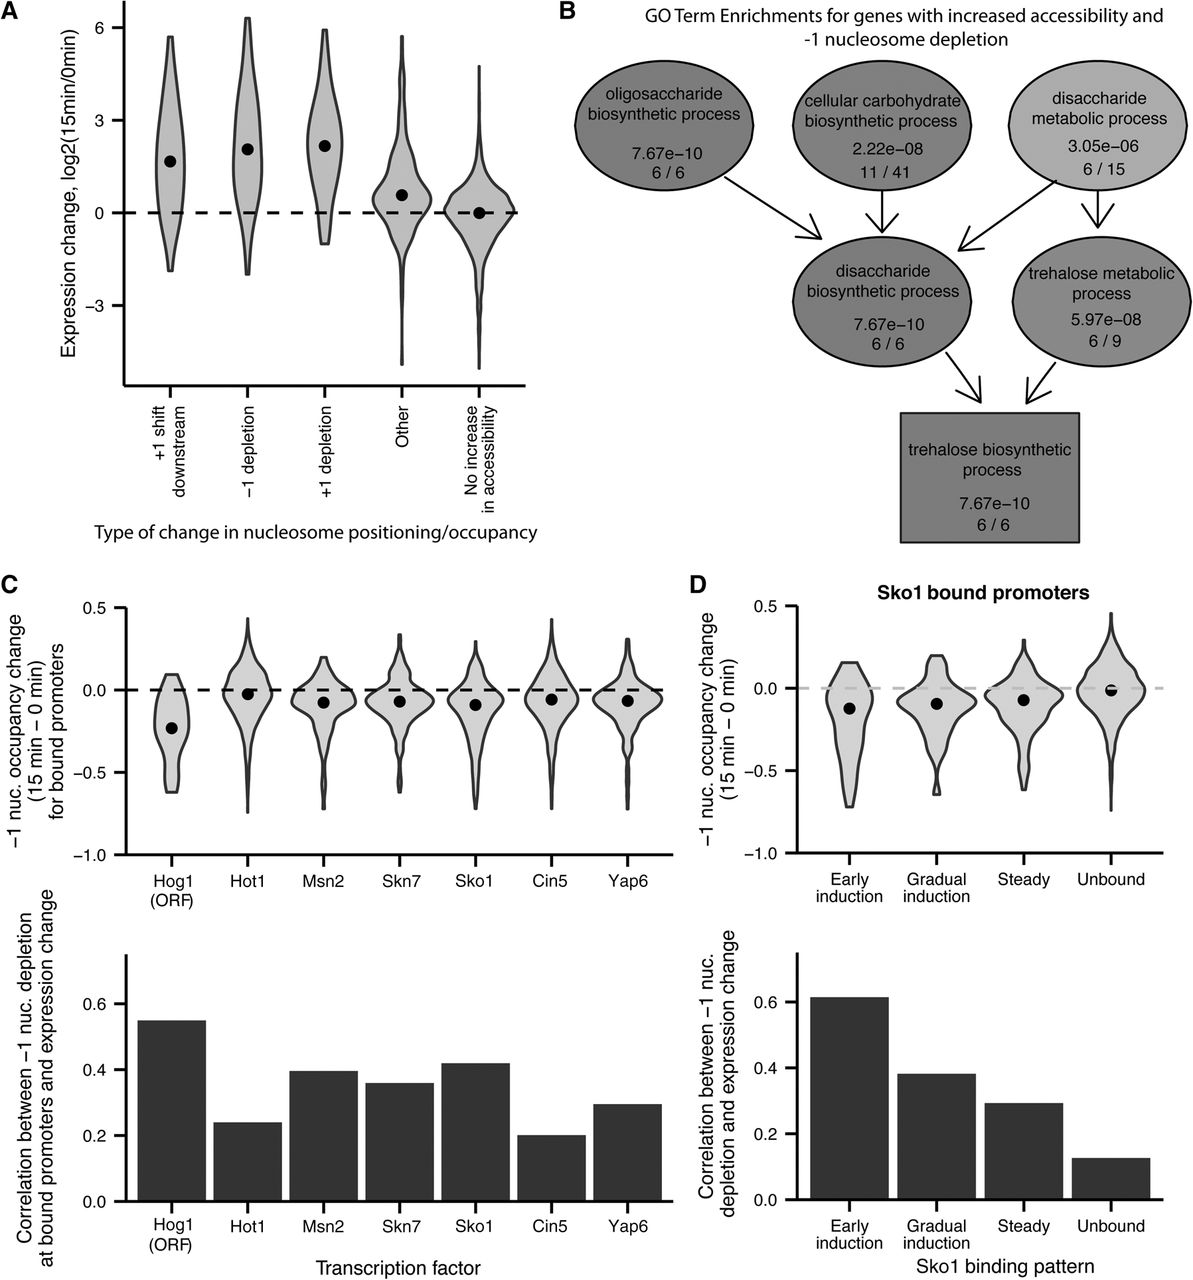
Changes in nucleosome positioning and occupancy during osmotic stress are linked to expression changes and mediated by TF binding. (A) Distribution of expression changes for promoters showing increased accessibility as well as different types of changes in nucleosome positioning or occupancy. (B) GO Term enrichment graph for genes with increased accessibility and depletion of the −1 nucleosome during the first 15 min of osmotic stress. (C) Distribution of changes in −1 nucleosome occupancy (top) and correlation between −1 nucleosome depletion and expression increases (bottom) for promoters bound by different TFs. (D) Distribution of changes in −1 nucleosome occupancy (top) and correlation between −1 nucleosome depletion and expression increases (bottom) for promoters with different Sko1 binding patterns.


