
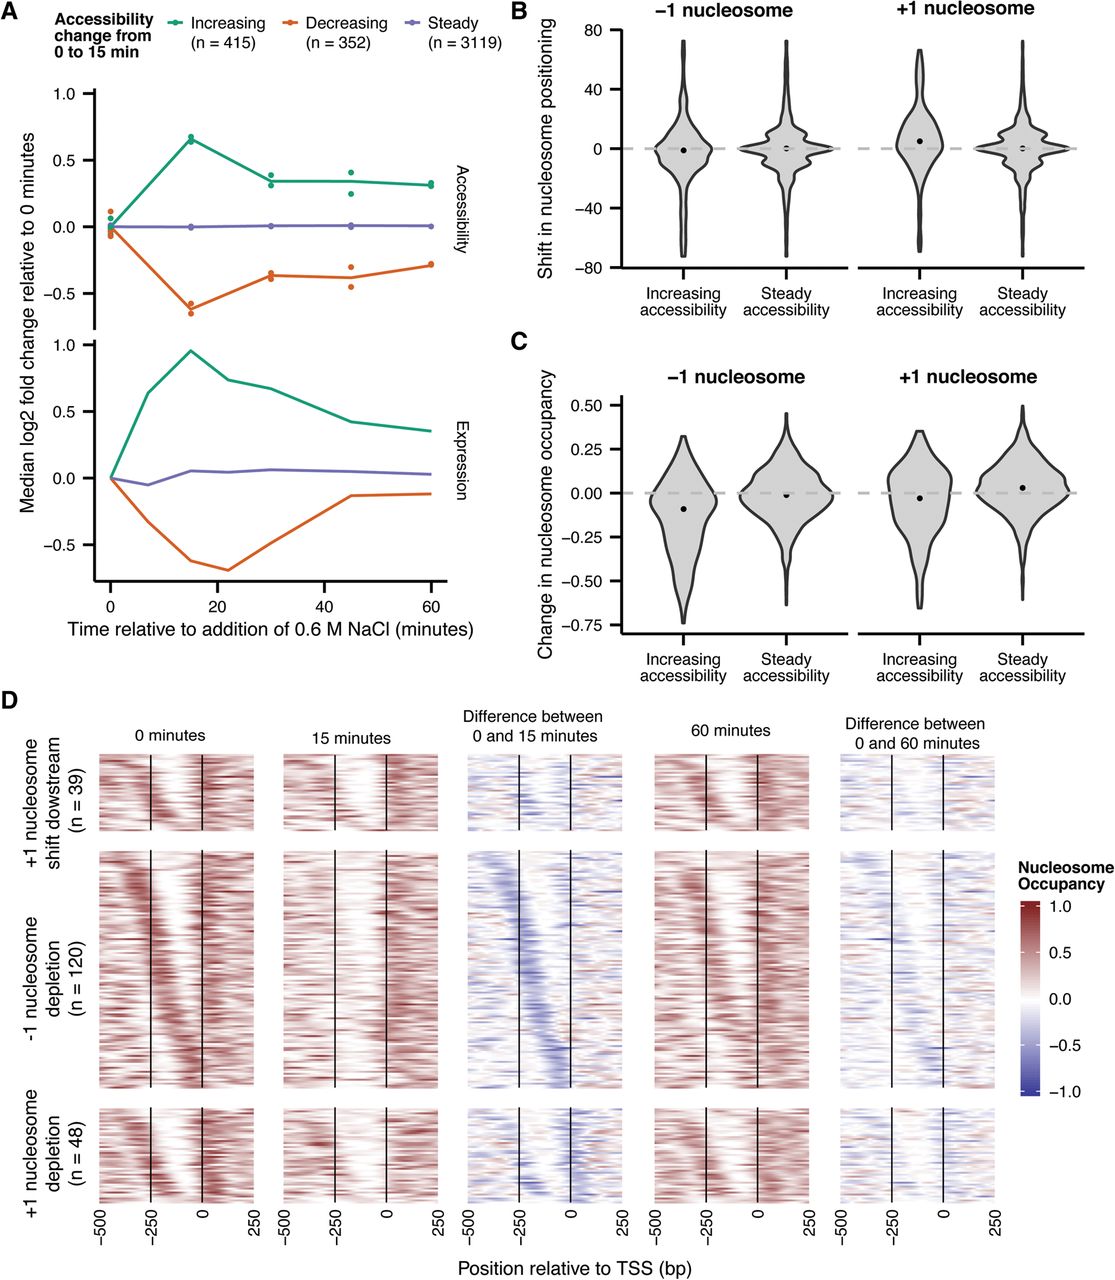
NucleoATAC reveals dynamics of nucleosome positioning and occupancy during osmotic stress response. (A) Promoter accessibility (top) and expression (bottom) changes over the osmotic stress time-course for genes showing an increase in accessibility from 0 to 15 min (green), a decrease in accessibility from 0 to 15 min (orange), or no significant change in accessibility between 0 and 15 min (purple). (B) Distribution of −1 and +1 nucleosome shifts for promoters with increasing accessibility and promoters with steady accessibility. (C) Distribution of −1 and +1 nucleosome occupancy changes for promoters with increasing accessibility and promoters with steady accessibility. (D) Individual occupancy traces for genes with significantly increased accessibility and characterized by either (1) downstream shifts in nucleosome positioning, (2) depletion of the −1 nucleosome, or (3) depletion of the +1 nucleosome during the first 15 min of the osmotic stress response. These categories do overlap.


