
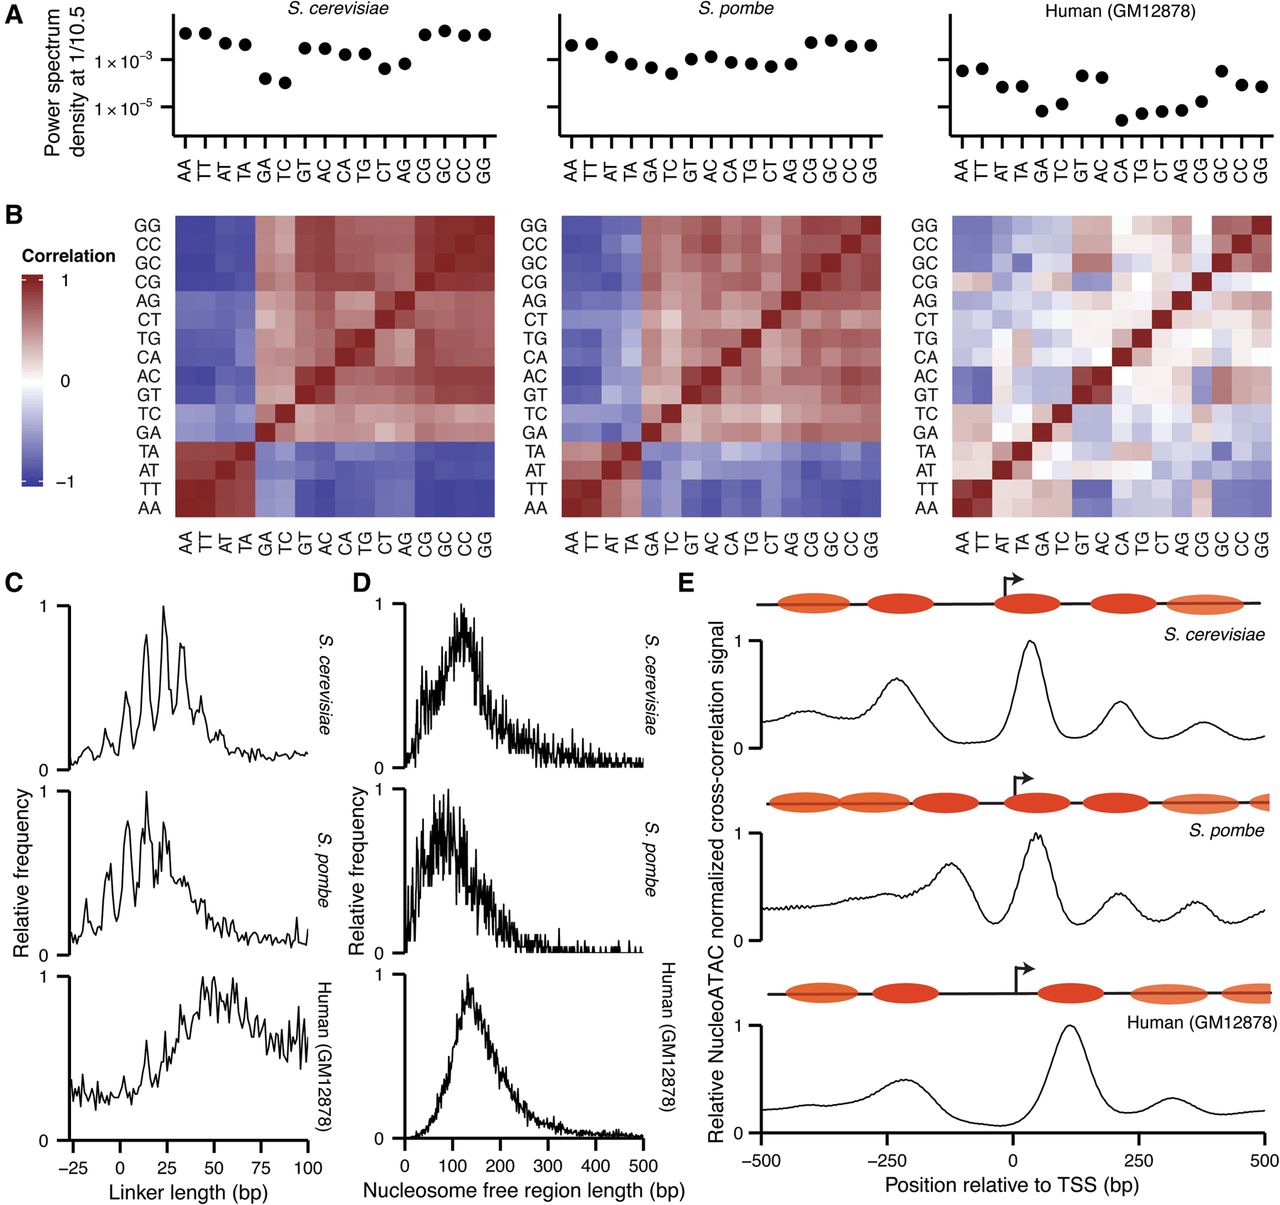
NucleoATAC reveals differences in nucleosome architecture between species. (A) Power spectrum density at 1/10.5 bp for each dinucleotide from 19 to 60 bp from NucleoATAC-called dyads for S. cerevisiae, S. pombe, and human (left to right). (B) Pair-wise correlation between dinucleotide frequencies for each species. (C) Distances between adjacent nucleosomes in three species. (D) Nucleosome-free region lengths for three species. (E) Positive NucleoATAC cross-correlation signal aggregated at TSS in three species. Cartoons show canonical nucleosome positioning at TSS for each species, with more transparent nucleosome ovals representing nucleosomes that are less consistently positioned among different TSSs.


