
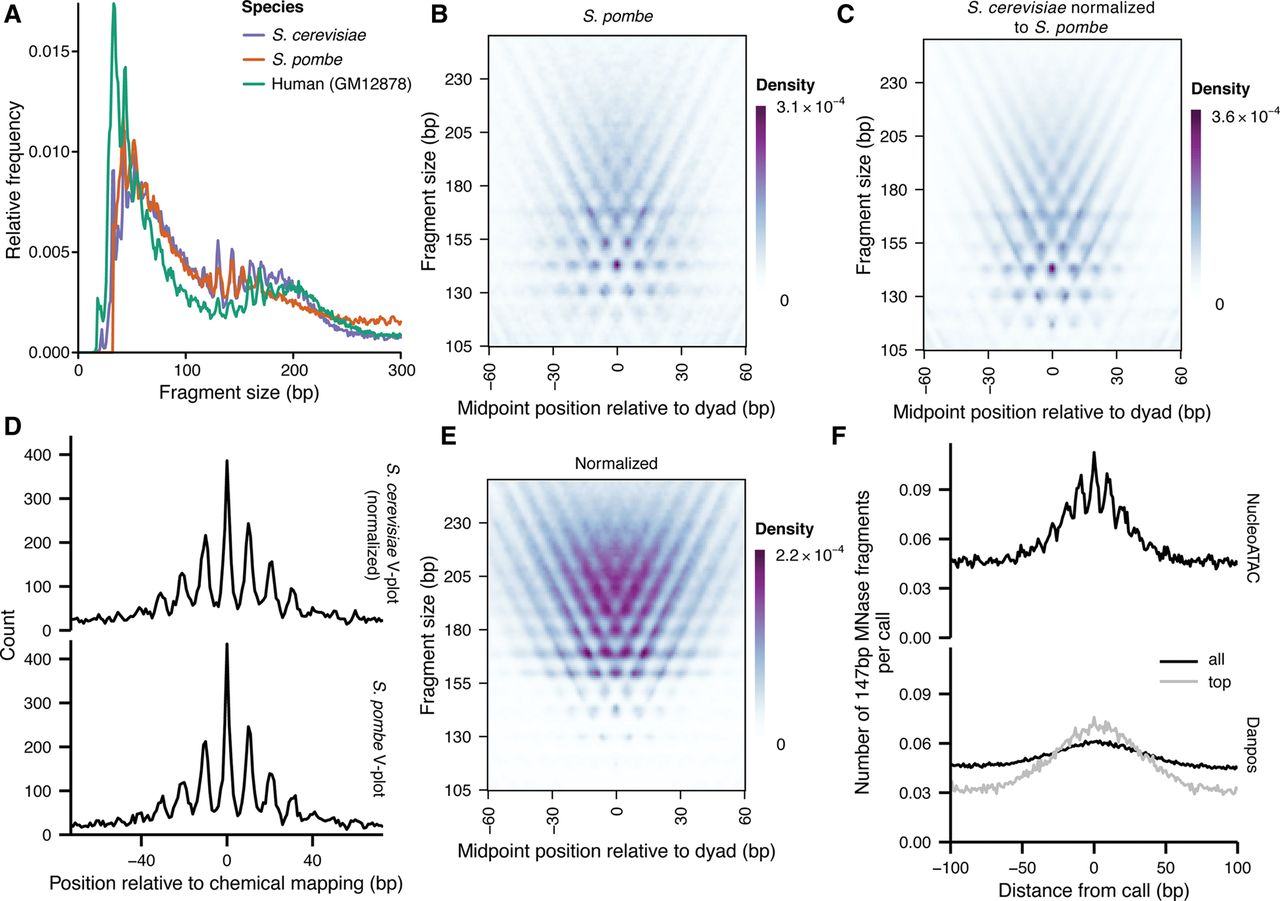
V-plot derived from S. cerevisiae can be used as a template to apply NucleoATAC to other species. (A) Fragment-size distributions for S. cerevisiae (purple), S. pombe (orange), and human GM12878 cell line (teal). (B) S. pombe V-plot based on chemical map calls for S. pombe. (C) S. cerevisiae V-plot normalized to match S. pombe fragment-size distribution. (D) Comparison of NucleoATAC concordance with chemical mapping for S. pombe when using V-plots in B or C. (E) S. cerevisiae V-plot normalized to match human GM12878 fragment sizes. (F) 147-bp MNase fragment density around calls for GM12878 made by either NucleoATAC (black curve in upper panel) or DANPOS (black and gray curves in lower panel; gray curve is restricted to top calls to match the number of calls made by NucleoATAC).


