
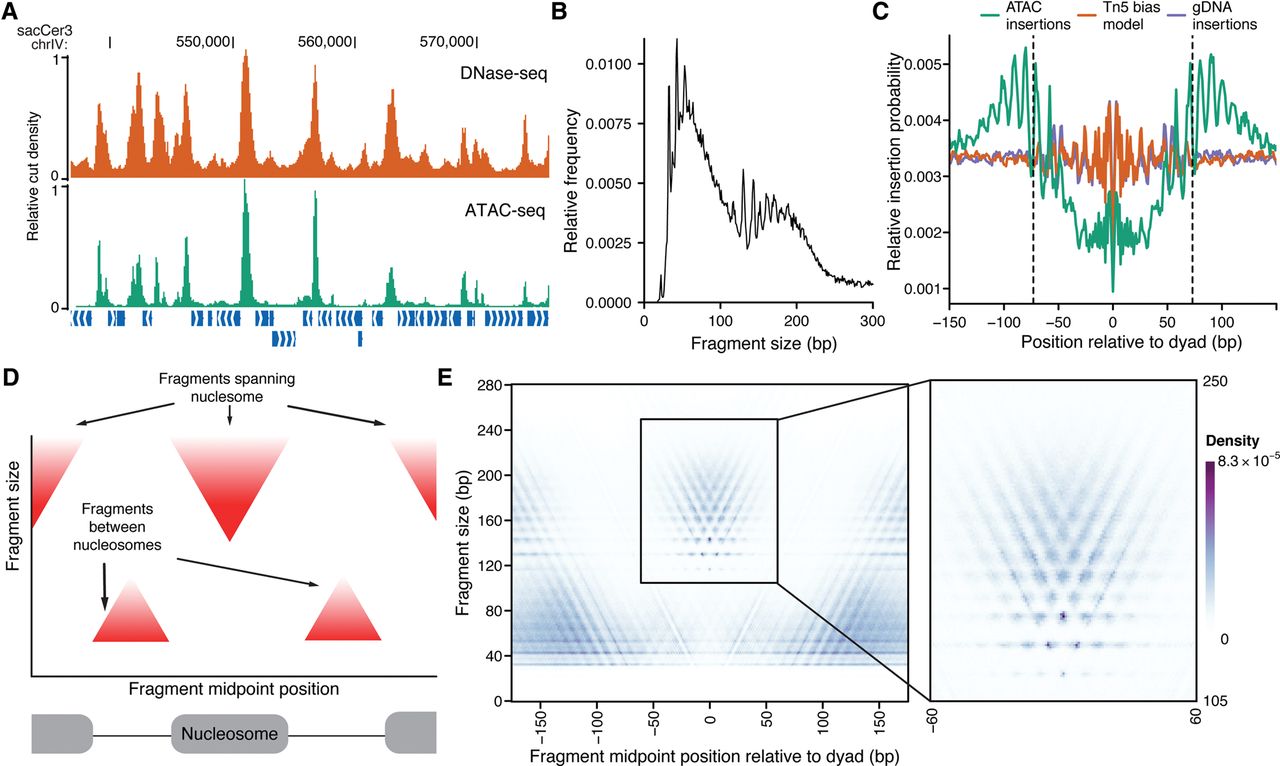
ATAC-seq signal is highly structured around nucleosomes. (A) ATAC-seq (green) insertion track for S. cerevisiae shows enrichment of insertions at accessible chromatin regions, similar to DNase-seq cut density (orange). Both tracks were smoothed by 150 bp and scaled so that the maximum density in the region is 1. (B) Fragment-size distribution for S. cerevisiae ATAC-seq samples. (C) Insertion probabilities for ATAC-seq (teal), genomic DNA (purple), and predicted by sequence bias (orange) (see Methods) around nucleosomes defined by chemical mapping. (D) Schematic illustration of expected V-plot pattern around a well-positioned nucleosome. (E) V-plot (fragment size versus fragment center position) of ATAC-seq fragments around well-positioned nucleosomes called by chemical mapping, with inset showing region with nucleosome-spanning fragments.


